
Everything you need to know about Ratio Tables
Get the free Ratio Tables worksheet and other resources for teaching & understanding Ratio Tables
Key Points about Ratio Tables
- Ratio tables are a structured list of equivalent ratios used to understand the relationship between ratios and numbers.
- They help students find equivalent ratios and solve problems that involve ratios and proportions.
- Understanding ratio tables is an important concept in 6th-grade mathematics that helps students solve problems and understand the relationship between different quantities.
Here’s how to do Ratio Tables
A Ratio Table is a table of values that show the relationship between two quantities. Ratio Tables are very helpful when working with relationships because they make it easier to understand the relationship between the two quantities. You can create a Ratio Table by multiplying the two quantities by the same number to fill in the table. You can also create a Ratio Table by dividing the two quantities by the same number to fill in the table. All of the values in the table will be equivalent ratios which allows you to reduce fractions or amounts to their most reduced form.
Ratio tables are an essential tool for understanding the relationship between two or more quantities. They are commonly used in mathematics to solve problems that involve ratios and proportions. A ratio table is a structured list of equivalent ratios that helps students understand the relationship between ratios and numbers.
In simple terms, a ratio is a comparison of two quantities. It is expressed as a fraction or a decimal. For example, the ratio of boys to girls in a class of 20 students can be expressed as 10/20 or 0.5. Ratio tables help students to understand the relationship between ratios and the numbers they represent. They are also used to find equivalent ratios, which have the same relationship between their numerators and denominators.
Ratio tables are an important concept in 6th-grade mathematics. They are used to solve problems that involve ratios and proportions, such as finding the missing value in a ratio or determining the ratio of two quantities. Students who understand ratio tables are better equipped to solve problems and understand the relationship between different quantities.
Common Core Standard: 6.RP.2
Related Topics: Proportions, Equivalent Ratios, Unit Rates, Converting Percents to Decimals, Converting Decimals to Percents
Return To: Home, 6th Grade
What are Ratio Tables?
So what is a ratio table anyway? A table that displays the connection between two separate quantities is called a Ratio Table. Ratio Tables are very useful while operating with relationships because they make it easier to understand the connection between the two quantities. In order to create a Ratio Table, you multiply or divide the two quantities by the same amount to fill in the table with the correct values.
Ratio tables are a visual representation of equivalent ratios. They are a tool that can be used to solve problems involving ratios. A ratio is a comparison of two quantities, often expressed as a fraction. For example, if there are 2 red balls and 3 blue balls in a bag, the ratio of red balls to blue balls is 2:3.
Uses
Ratio tables are useful in many different situations. Here are a few examples:
- Proportions: Ratio tables can be used to solve proportion problems. For example, if 5 apples cost $3.75, how much would 10 apples cost? By setting up a ratio table, it becomes clear that the cost of 10 apples would be $7.50.
- Scaling: Ratio tables can be used to scale up or down quantities. For example, if a recipe calls for 1 cup of flour and you want to make twice as much, a ratio table can be used to determine that you need 2 cups of flour.
- Problem Solving: Ratio tables can be used to solve a variety of problems involving ratios. For example, if a car travels 60 miles in 2 hours, how far will it travel in 3 hours? By setting up a ratio table, it becomes clear that the car will travel 90 miles in 3 hours.
Ratio tables are a powerful tool for solving problems involving ratios. They provide a visual representation of equivalent ratios, making it easier to see the relationship between different quantities. By using ratio tables, you can quickly and easily solve a variety of problems involving ratios.
Ratio Tables Definition
Ratio tables are a mathematical tool used to represent and analyze the relationship between two or more quantities. They are a visual representation of ratios, which are used to compare two or more quantities and express their relative sizes. A ratio table is a table that displays the constant relationship between two values. The constant relationship can be observed through a set of data points.
Ratio tables can be used to solve a variety of problems, including those related to proportions, scaling, and rates. They are particularly useful in situations where the relationship between two quantities is not immediately clear, or when one quantity depends on another in a complex way.
Ratio tables consist of two or more columns, with each column representing a different quantity or ratio. The columns are usually labeled with letters or symbols to indicate the quantities they represent. Each row in the table represents a different set of values for the quantities, and the values in each row are related to each other by a constant ratio.
For example, a ratio table might be used to represent the relationship between the length and width of a rectangle. The first column of the table would represent the length of the rectangle, while the second column would represent the width. Each row in the table would represent a different rectangle with a different length and width, and the values in each row would be related to each other by a constant ratio.
Overall, ratio tables are a powerful tool for analyzing and understanding the relationship between two or more quantities. They are used in a wide variety of fields, including mathematics, science, engineering, and finance.
How to Solve Ratio Tables in 5 Simple Steps
Ratio tables are tables of values that show the relationship between two quantities. They are commonly used in math problems to help solve for an unknown variable. Here are the steps to follow when doing ratio tables:
Steps
- Identify the ratios: The first step is to identify the ratios that are given in the problem. For example, if the problem states that there are 3 boys for every 5 girls, then the ratio is 3:5.
- Determine the equivalent ratios: The next step is to determine the equivalent ratios by multiplying or dividing the original ratios. For example, if the original ratio is 3:5, then the equivalent ratios could be 6:10 or 9:15.
- Fill in the ratio table: Once the equivalent ratios have been determined, the next step is to fill in the ratio table. The table should have two columns, one for each ratio. The first row of the table should contain the original ratio, and the subsequent rows should contain the equivalent ratios.
- Solve for the unknown variable: If the problem requires solving for an unknown variable, the ratio table can be used to do so. For example, if the problem states that there are 24 boys, and the ratio of boys to girls is 3:5, then the number of girls can be found by setting up a proportion using the ratio table.
- Check the answer: It is important to check the answer to ensure that it makes sense in the context of the problem.
By following these steps, anyone can learn how to do ratio tables and use them to solve math problems.
Ratio Tables Examples
Ratio tables are a powerful tool for understanding and solving problems involving ratios. Here are a few examples of how ratio tables can be used:
Example 1: Cookies and Milk
Suppose Ben drinks 1 glass of milk for every 2 cookies that he eats. To build a ratio table for this situation, we can start with the ratio 1:2 and then multiply both the numerator and denominator by the same number to generate equivalent ratios. Here’s what the ratio table would look like:
| Glasses of Milk | Cookies |
|---|---|
| 1 | 2 |
| 2 | 4 |
| 3 | 6 |
| 4 | 8 |
Notice that each row of the table represents a different ratio, but all of the ratios are equivalent because they have the same ratio of milk to cookies.
Example 2: Mixing Paint
Suppose a painter wants to mix red and blue paint to create a purple color. If the ratio of red to blue paint is 3:5, then a ratio table can be used to determine the amounts of each color needed to create different shades of purple. Here’s what the ratio table would look like:
| Red Paint | Blue Paint | Purple Paint |
|---|---|---|
| 3 | 5 | 8 |
| 6 | 10 | 16 |
| 9 | 15 | 24 |
| 12 | 20 | 32 |
Again, notice that each row of the table represents a different ratio, but all of the ratios are equivalent because they have the same ratio of red to blue paint.
Example 3: Speed and Distance
Suppose a car travels at a constant speed of 60 miles per hour. A ratio table can be used to determine the distance traveled after different amounts of time. Here’s what the ratio table would look like:
| Time (hours) | Distance Traveled (miles) |
|---|---|
| 1 | 60 |
| 2 | 120 |
| 3 | 180 |
| 4 | 240 |
Notice that in this case, the ratios are not equivalent because the amount of distance traveled depends on the amount of time elapsed. However, a ratio table can still be used to organize the information and make calculations easier.
5 Quick Ratio Tables Practice Problems
3 Easy Steps to complete Equivalent Ratio Tables
Equivalent ratio tables show pairs of corresponding values with an equal ratio between each pair. This means that the ratios in the table have the same value, even though the actual numbers may be different.
- Complete the Ratio Table Example by filling in the correct amount in each missing spot.
- You can find the missing amounts by using multiplication or division to find the equivalent ratios.
- Once you know the number that you have to multiply or divide by to fill in the table, you can use it to complete the table.
To create an equivalent ratio table, start with a given ratio and then multiply or divide each term by the same number. This will create a new ratio that is equivalent to the original ratio. For example, if the original ratio is 2:3, multiplying both terms by 2 will give an equivalent ratio of 4:6.
Equivalent ratio tables are useful in many different mathematical contexts. For example, they can be used to compare different quantities, to find missing values in a ratio, or to determine if two ratios are equivalent.
Here are some key features of equivalent ratio tables:
- Equivalent ratios have the same value, even if the actual numbers are different.
- Ratio tables show pairs of corresponding values with an equal ratio between each pair.
- Equivalent ratio tables can be used to compare different quantities, find missing values, or determine if two ratios are equivalent.
Overall, equivalent ratio tables are a powerful tool for understanding ratios and proportions. By using these tables, students can quickly and easily compare different quantities, find missing values, and determine if two ratios are equivalent.
How to Create Ratio Tables in 6th Grade
Ratio Tables are a tool that students use to visualize the relationship between two quantities. They are commonly used in 6th-grade math problems and are an essential skill for students to master. Here are the steps to create a Ratio Table:
- Identify the two quantities that are being compared. For example, if the problem states that there are 6 boys and 12 girls in a class, the two quantities are boys and girls.
- Create a table with two columns. Label the first column with the name of the first quantity and the second column with the name of the second quantity.
- Fill in the first row of the table with the given values. In the example above, the first row would be 6 for boys and 12 for girls.
- Determine the ratio between the two quantities. To do this, divide the second quantity by the first quantity. In the example above, the ratio is 12/6 = 2.
- Fill in the rest of the table by multiplying the first quantity by the ratio. In the example above, the second row would be 12 for girls and 24 for boys (6 x 2).
- Continue filling in the table until you have enough information to solve the problem.
It’s important to note that Ratio Tables can be used for more than just two quantities. If a problem involves three or more quantities, simply add additional columns to the table and follow the same steps.
By following these steps, students can create Ratio Tables to help them solve a wide variety of math problems.
FAQ about Solving Ratio Tables
How do you solve problems using ratio tables?
To solve problems using ratio tables, you need to first identify the relationship between the quantities in question. Then, organize the information in a table with equivalent ratios. Once you have a table, you can use it to find missing values or compare quantities.
What are some real-world applications of ratio tables?
Ratio tables are commonly used in cooking to adjust recipes for different serving sizes. They are also used in construction to determine the amount of materials needed for a project. Additionally, businesses use ratio tables to analyze financial data and make informed decisions.
Can you use ratio tables to compare quantities?
Yes, ratio tables are an effective way to compare quantities. By organizing the information in a table, you can easily see how the quantities relate to each other and make comparisons.
What is the relationship between ratios and fractions in a ratio table?
Ratios and fractions are closely related in a ratio table. Each ratio in the table can be expressed as a fraction, and the fractions can be simplified or converted to decimals as needed.
How can you use a ratio table to find missing values?
To find a missing value in a ratio table, you can use the equivalent ratios to set up a proportion. Then, you can cross-multiply and solve for the missing value.
What are some common mistakes to avoid when working with ratio tables?
One common mistake is to confuse the order of the quantities in the ratio. It’s important to keep the order consistent throughout the table. Another mistake is to forget to simplify the fractions in the table. Simplifying can make the calculations easier and help avoid errors.
How do you divide using ratio tables?
To divide using ratio tables, you can set up the ratios as fractions and then divide them. For example, if you have a ratio of 3:4, you can write it as 3/4 and divide by the denominator to get 0.75.
Watch the video explanation of our Ratio Tables Worksheets
Watch our free video on how to solve Ratio Tables. This video shows how to solve problems that are on our free Ratio Table worksheets that you can get by submitting your email above.
Watch the free Ratio Tables Definition video on YouTube here: How to Solve Ratio Tables Video
Video Transcript:
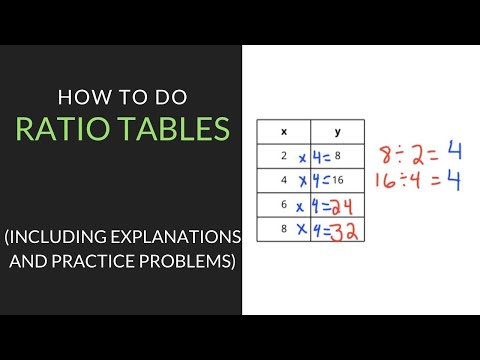
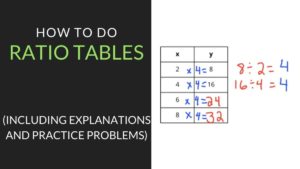
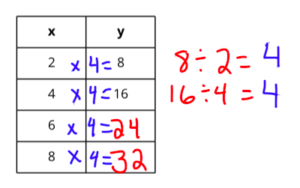
This video is about how to do ratio tables 6th grade. You can get the ratio table worksheet used in this video for free by clicking on the link in the description below. Ratio tables are just tables that are used to describe the relationship between two separate quantities. Ratio tables are helpful for visualizing the relationship between the two separate quantities. In order to complete ratio tables, you can use either multiplication or division. For example, if you had this ratio table and you need to fill in the two missing cells you could use either multiplication or division. If you are able to look at the x column which is counting by 2. It’s 2 4 6 8 and determine what you can multiply by to get to the y column then you don’t have to worry about division. If you can’t do the multiplication in your head then you’re going to need to divide the y column divided by the x column to get the common multiplier. Just giving an example of this we’re going to take the y column which is 8 and divided by the x column which is 2. This first row right here 8 divided by 2 of course is 4. I know that my multiplier for the first row is going to be 2 times 4. Then we can check again with the second row and do 16 divided by four. Again, y divided by x and again we will get four. We know the multiplier for the second row is also four this means that the multiply for the remaining rows is also going to be times four. In order to fill in these cells you just have to take your x values and multiply them times four. To get this cell we’re going to do 6 times 4 which is 24 and then to find the last value we just do 8 times 4 which is 32. Now our ratio table is complete and we completed it by using multiplication and by division.
Let’s complete a couple practice problems on our ratio tables worksheet. The first problem we’re going to complete on our ratio tables worksheet to show you how to do a ratio table is number one. The directions say complete each ratio table by finding the missing values. Again, we can use multiplication or division to figure out what our common multiplier is since the ratio tables show the relationship between two quantities. The relationship will always be constant. You will always be able to multiply by a constant multiplier. If you can look at this and determine how you go what you can multiply the x column by to get to the y column then you don’t have to do division. I’m going to use division just to show an example. We’re going to do the y column which is 6 divided by the x column which is 2 to figure out the common multiplier 6 divided by 2 is 3. I know to go from x to y we multiply times three for the first row. For the second row should be the same so we’re going to do nine divided by three which is also three. I know the common multiplier again is three and we can use the common multiplier to figure out our missing values and our last two cells the third x is 4. We’re going to use 4 times our common multiplier which is 3, that’s 12. I know that cell is 12, and then 5 times 3 I know is 15, I know the last cell is 15. And this is how you complete a ratio table that shows a relationship between two separate quantities.
The last problem we’re going to complete on our ratio tables worksheet to show you how to complete a ratio table is number five. This problem gives us an x column and a y column and we have to fill in the missing cells. In order to fill in the missing cells this time we cannot use the first row because we’re missing the y value but we can use the second row and we can use the last row. Again, if you can look at this and determine what the multiplier is going to be you don’t have to do division. I’m going to use division just to show you so we’re going to divide the y column divided by the x column. This first one is going to be 14 divided by seven this will give us our common multiplier which is two 14 divided by seven is two. We do seven times two to get fourteen and then you do the same thing for the last row but this time it’s 26 divided by 13 which is also 2. I know the common multiplier is 2. I can do times 2 for the remaining rows to find the missing values four times two is eight. That’s our first missing value and then ten times two is twenty. That’s our last missing value hopefully you found this video helpful for teaching you how to solve a ratio table.
Ratio Tables Worksheet Free Download

Enter your email to download the free Ratio Tables worksheet
Practice makes Perfect.
We have hundreds of math worksheets for you to master.
Share This Page