
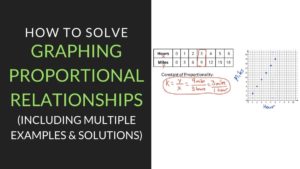
The Guide to Graphing Proportional Relationships
Get the free Graphing Proportional Relationships worksheet and other resources for teaching & understanding how to Graph Proportional Relationships

Key Points about Graphing Proportional Relationships
- Proportional relationships occur when two quantities have a constant ratio.
- To graph proportional relationships, plot points on a coordinate plane and connect them with a straight line.
- Graphing proportional relationships can help in making predictions and analyzing trends in data.
Here’s how to Graph Proportional Relationships
Graphing proportional relationships is an essential skill in mathematics. It involves understanding how quantities relate to one another and how they can be represented visually. Proportional relationships occur when two quantities have a constant ratio, and this ratio can be expressed as a fraction.
To understand proportional relationships, it is essential to have a solid grasp of ratios and rates. Ratios are a way of comparing two quantities, while rates are ratios that involve units of measurement. For example, if there are 6 boys and 4 girls in a class, the ratio of boys to girls is 6:4 or 3:2. If the class has a total of 20 students, the rate of boys to girls is 6/4 or 3/2.
Graphing proportional relationships involves plotting points on a coordinate plane and connecting them with a straight line. The line passes through the origin, and the slope of the line represents the constant ratio between the two quantities. Graphing proportional relationships can help in making predictions and analyzing trends in data.
Graphing Proportional Relationships can be completed by using values from a table or from an equation that contains a Proportional Relationship. Proportional Relationships are relationships that contain ratios that have a Constant of Proportionality. The Constant of Proportionality is the multiplier that relates the variables together. Finding the Constant of Proportionality involves multiplying or dividing between the variables to find the number that relates the variables. You can write the Constant of Proportionality by using the equation y=kx where k is the Constant of Proportionality.
Common Core Standard: 7.RP.2
Related Topics: Constant of Proportionality, What is a Proportional Relationship
Return To: Home, 7th Grade
2 Easy Rules for Understanding Proportional Relationships
Proportional relationships are a fundamental concept in mathematics. They describe the relationship between two variables that are directly proportional to each other. In other words, as one variable increases, the other variable increases at a constant rate. Understanding proportional relationships is essential for interpreting graphs and solving real-world problems.
Graphing Basics
Graphing proportional relationships is a common way to visualize these relationships. To graph a proportional relationship, you need to plot the values of the two variables on a coordinate plane. The horizontal axis represents the independent variable, while the vertical axis represents the dependent variable. In a proportional relationship, the graph is a straight line that passes through the origin.
Understanding Slope and Origin
The slope of the line represents the rate of change between the two variables. In a proportional relationship, the slope is constant and equal to the ratio of the dependent variable to the independent variable. For example, if y is directly proportional to x, then the slope of the line is equal to y/x.
The origin is the point where the line intersects the x and y axes. In a proportional relationship, the origin is always (0,0) because when the independent variable is zero, the dependent variable is also zero. The constant of proportionality is the ratio of the dependent variable to the independent variable when the independent variable is equal to one. It is represented by the y-intercept of the line.
Understanding proportional relationships is an essential skill for solving real-world problems. For example, if you know that the cost of a product is directly proportional to the number of units purchased, you can use a proportional relationship to calculate the total cost for any number of units. Similarly, if you know that the speed of a car is directly proportional to the distance traveled, you can use a proportional relationship to calculate the time it takes to travel a certain distance.
In summary, understanding proportional relationships is crucial in mathematics. It involves understanding the basic concepts of graphing, slope, and origin. Once you understand these concepts, you can use proportional relationships to solve real-world problems involving rates, ratios, and constants.
How to Graph Proportional Relationships: Step-by-Step Guide
Graphing proportional relationships is an essential skill in mathematics. It involves plotting points on a graph and drawing a line that passes through these points. The line should pass through the origin (0,0) and be straight. Here are the steps to graph proportional relationships:
- Identify the two variables that are proportional to each other. For example, the number of hours worked and the amount of money earned.
- Choose a scale for the x and y-axes. The scale should be such that all the data points can fit on the graph.
- Plot the data points on the graph. Each data point should be represented by a dot.
- Draw a straight line that passes through all the data points. The line should pass through the origin (0,0).
- Label the x and y-axes with the appropriate units.
- Write an equation for the line in slope-intercept form (y = mx + b), where m is the slope of the line and b is the y-intercept.
- Check if the line passes through the origin. If it does, then the two variables are proportional to each other.
- Interpret the slope of the line. The slope represents the rate of change of the dependent variable (y) with respect to the independent variable (x).
- Use the graph to make predictions. For example, if the line represents the relationship between the number of hours worked and the amount of money earned, then one can predict how much money will be earned for a given number of hours worked.
By following these steps, one can graph proportional relationships accurately and make predictions based on the data.
5 Quick Graphing Proportional Relationships Practice Problems
Graphing Proportional Relationships Examples
Graphing proportional relationships is an essential part of understanding the relationship between two variables that are proportional to each other. By plotting the ordered pairs on a graph, you can easily visualize the relationship between the two variables.
For example, consider the following proportional relationship between the number of hours worked and the amount earned:
| Hours Worked | Amount Earned |
|---|---|
| 1 | 10 |
| 2 | 20 |
| 3 | 30 |
| 4 | 40 |
To graph this relationship, you can plot the ordered pairs on a coordinate plane. The horizontal axis represents the hours worked, and the vertical axis represents the amount earned. Each ordered pair can be represented by a point on the graph.
In this example, the graph is a straight line passing through the origin. This is because the relationship between the two variables is directly proportional. As the number of hours worked increases, the amount earned also increases proportionally.
Another example of a proportional relationship is the relationship between distance and time. Consider the following data:
| Time (minutes) | Distance (miles) |
|---|---|
| 5 | 1 |
| 10 | 2 |
| 15 | 3 |
| 20 | 4 |
To graph this relationship, you can plot the ordered pairs on a coordinate plane. The horizontal axis represents the time in minutes, and the vertical axis represents the distance in miles.
In this example, the graph is a straight line passing through the origin. This is because the relationship between the two variables is directly proportional. As the time increases, the distance traveled also increases proportionally.
In conclusion, graphing proportional relationships is a powerful tool for understanding the relationship between two variables that are proportional to each other. By plotting the ordered pairs on a graph, you can easily visualize the relationship between the two variables and make predictions about the relationship.
Variables in Proportional Relationships
In proportional relationships, there are two variables that are related to each other in a constant ratio. The first variable is usually denoted by “x” and represents the independent variable, while the second variable is denoted by “y” and represents the dependent variable.
When x increases or decreases, y also increases or decreases in proportion to x. The relationship between x and y is often expressed as y = kx, where “k” is the constant of proportionality. This means that the ratio of y to x is always equal to the same value, which is k.
For example, if y is directly proportional to x, and y = 3 when x = 2, then we can write the equation as y = kx, where k is the constant of proportionality. To find the value of k, we can substitute the values of x and y into the equation and solve for k.
In this case, k = y/x = 3/2 = 1.5. Therefore, the equation for this proportional relationship is y = 1.5x. This means that for every unit increase in x, y increases by 1.5 units.
It is important to note that in proportional relationships, the ratio of the change in y to the change in x is always equal to the constant of proportionality. This means that if x increases by a certain amount, y will also increase by the same ratio.
In summary, in proportional relationships, there are two variables, x and y, that are related in a constant ratio. The relationship between x and y is often expressed as y = kx, where k is the constant of proportionality. The ratio of the change in y to the change in x is always equal to the constant of proportionality, which means that if x increases or decreases, y will also increase or decrease in proportion to x.
FAQ about Proportional Relationship Graphs
What are some real-life examples of proportional relationships?
Proportional relationships can be found in many real-life situations. For example, the relationship between distance and time when traveling at a constant speed is proportional. The more time you spend traveling, the farther you will go. Another example is the relationship between the number of workers and the amount of work completed in a certain amount of time. The more workers you have, the more work can be completed in a given time frame.
How do you determine if a relationship is proportional?
To determine if a relationship is proportional, you need to check if the ratio between the two variables remains constant. In other words, if you double one variable, the other variable should also double. You can check this by calculating the ratio between the two variables for different values and seeing if it remains the same.
What is the equation for a proportional relationship?
The equation for a proportional relationship is y = kx, where y is the dependent variable, x is the independent variable, and k is the constant of proportionality. The constant of proportionality is the ratio between the two variables and remains the same for all values of x and y.
Can a proportional relationship have a negative slope?
No, a proportional relationship cannot have a negative slope. The slope of a proportional relationship is always positive because the ratio between the two variables is always positive.
How do you graph a proportional relationship?
To graph a proportional relationship, plot the ordered pairs (x, y) on a coordinate plane and connect them with a straight line passing through the origin. The slope of the line should be equal to the constant of proportionality.
What is the difference between a direct variation and a proportional relationship?
A direct variation is a specific type of proportional relationship where the constant of proportionality is equal to 1. In other words, the equation for a direct variation is y = kx, where k = 1. All direct variations are proportional relationships, but not all proportional relationships are direct variations.
Graphing Proportional Relationships Worksheet Video Explanation
Watch our free video on how to Graph Proportional Relationships. This video shows how to solve problems that are on our free Graphing Proportional Relationships worksheet that you can get by submitting your email above.
Watch the free Graphing Proportional Relationships video on YouTube here: Graphing Proportional Relationships Video
Video Transcript:
This video is about graphing proportional relationships. You can get the graph proportional relationships worksheet used in this video for free by clicking on the link in the description below. In order to show you how to solve proportional relationship in graphs, we’re going to do a couple practice problems from our graphing proportional relationships worksheet.
The first problem we’re going to do on our proportional relationship graph worksheet is number two. This problem gives us a table, a graph, and asks us to solve for the constant of proportionality. The first thing we’re going to do is we’re going to use our table to complete our proportional relationship graph on the right. The first thing we can do is we can label our axes on our graph. We know that the x-axis is going to be minutes. We know this axis is going to be minutes and we know that the y-axis is going to be feet. In order to graph this, we use the values that are given to us in our proportional table here. Our first point is going to be 0 0. We put a dot on 0 0. The second point that is given to us is 1 minute and then 2 feet. We go over to our proportional relationship graph and we go to 1 minute and then up to two feet and we put our second dot. The third point we can put on our graph is minutes is two and feet is four. We go over to two minutes and then up to four feet and we put our third dot, fourth point is going to be minutes is three and then feet is six, we put a dot there and then our last point gives us minutes is four, four minutes and then eight feet. We put our last dot there.
Now that our proportion relationship has been graphed, we can find the constant of proportionality. The constant of proportionality is given as the equation k equals y divided by x, and k is the constant of proportionality, y is the y values, and x is the x values. Our x axis is minutes so we know the minutes represent the x values and the y axis is feet. We know feet are represented by the y axis. In order to solve our formula k equals y divided by x we can use any column from our table as long as we put feet in for y and minutes in for x. I’m going to use this fourth column, which gives us three minutes and six feet so our feet is six. We know that’s the y value the minutes are three, we know that’s the x value. To simplify this, we’re going to do 6 divided by 3 which is 2. Now we know that the constant of proportionality is 2 feet every minute and that’s going to be the solution.
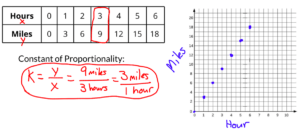
The last problem we’re going to complete on our proportional graphs worksheet is number three. The first step is to use our table to complete the graphs of proportional relationships on the right. Again, we’re going to use the values from each column to plot the points on our graph here. The first step is to label our axes so we’re going to label hours on the x-axis and then miles on the y-axis in order to complete the proportion relationships graph. We’re going to use the columns from the table to plot our points. The first column gives us 0 0. That’s going to be our first point, second column gives us 1 hour is 3 miles, we put a dot there, this third column gives us 2 hours is 6 miles, and then 3 hours is nine miles and then four hours.
We go to hour four and then up to 12 miles, and then five hours, and then 15 miles and then finally six hours which is 18 miles. Now that our proportional relationship has been graphed, we can find the constant of proportionality. We know that the constant of proportionality is equal to the y values divided by the x values and we know that the x values are represented by hours and the y values are represented by miles. We can take any column that we want to find the constant of proportionality. I’m going to use column number four. This column gives us miles, which is our y value as nine, this is 9 miles divided by our hours column which is 3. It’s 3 hours and then when you reduce this, you’ll get 9 divided by 3. It’s three miles for every one hour and that’s going to be our solution. You can try all these practice problems by downloading the free graphing proportional relationships worksheets above.
Free Proportional Relationship Graph worksheet download

Enter your email to download the free Graphing Proportional Relationship worksheet
Practice makes Perfect.
We have hundreds of math worksheets for you to master.
Share This Page