
Solving Systems of Equations by Graphing Worksheet, Examples, and Answers
Get the free Solving Systems of Equations by Graphing worksheet and other resources for teaching & understanding Solving Systems of Equations by Graphing
Key Points about Systems of Equations with Graphing
- Solving systems of equations is a fundamental concept in algebra.
- Graphing is a visual method that allows us to see the solutions of a system of equations.
- By plotting the equations on a coordinate plane, we can find the point where the two lines intersect, which represents the solution to the system.
Solving Systems of Equations Graphically
Solving Systems of Equations by Graphing is a method to solve a system of two linear equations. Solving Systems of Equations by Graphing follows a specific process in order to simplify the solutions. The first thing you must do when Solving Systems of Equations by Graphing is to graph each equation. When graphing the equations you start with the y-intercept, or where the line crosses the y-axis. Next, you use the slope to plot the next points and graph the lines. Slope is the rise divided by the run for the equation. The last step when Solving Systems of Equations by Graphing is to locate the point of intersection between the two lines.
Solving systems of equations is a fundamental concept in algebra. It involves finding the values of variables that make two or more equations true at the same time. There are several methods to solve systems of equations, including graphing, substitution, and elimination. In this article, we will focus on solving systems of equations by graphing.
Graphing is a visual method that allows us to see the solutions of a system of equations. By plotting the equations on a coordinate plane, we can find the point where the two lines intersect, which represents the solution to the system. Graphing is a useful method when dealing with linear equations, which are equations that form straight lines when graphed.
Common Core Standard: 8.EE.C
Related Topics: Identifying One, None, Infinite Solutions, Solving Systems by Elimination, Solving Systems by Substitution
Return To: Home, 8th Grade
Solving Systems of Equations with Graphing
Graphing is a visual method of solving a system of equations with two variables. A system of equations is a set of two or more equations with two or more variables. For example, a system of two equations with two variables can be represented as:
y = mx + b
y = nx + c
where m, n, b, and c are constants and x and y are variables.
To solve a system of equations by graphing, each equation is graphed on the same coordinate plane. The point of intersection of the two lines is the solution to the system of equations. If the lines are parallel, there is no solution, and if the lines are coincident, there are infinitely many solutions.
Graphing a system of equations involves finding two points on each line and connecting them with a straight line. The easiest way to find two points on a line is to use the intercepts. The x-intercept is the point where the line crosses the x-axis, and the y-intercept is the point where the line crosses the y-axis.
To find the x-intercept, set y to zero and solve for x. To find the y-intercept, set x to zero and solve for y. Once you have two points, connect them with a straight line.
It is important to note that the solution to a system of equations is the point of intersection of the two lines. To find the solution, simply read the coordinates of the point of intersection from the graph.
Graphing is a useful method of solving a system of equations with two variables. It is particularly useful when the equations are given in slope-intercept form, which is of the form y = mx + b, where m is the slope and b is the y-intercept.
How to Solve Systems of Equations by Graphing
When solving systems of equations, one method is to use graphical methods. This section will explain how to solve systems of equations by graphing. It will cover the basics of graphing, linear equations and their graphs, interpreting intersection points, and types of systems: consistent and inconsistent.
Graphing Basics
Before solving systems of equations by graphing, it is important to understand the basics of graphing. A graph is a visual representation of data that shows the relationship between two variables. In the case of linear equations, the variables are x and y. The graph of a linear equation is a straight line.
Linear Equations and Their Graphs
A linear equation is an equation that can be written in the form Ax + By = C, where A, B, and C are constants and x and y are variables. The graph of a linear equation is a straight line. To graph a linear equation, it is necessary to plot two points on the plane and then connect them with a straight line.
Interpreting Intersection Points
The intersection point of two lines represents a solution that satisfies both equations. To find the intersection point, it is necessary to graph both equations on the same coordinate plane. The intersection point is the point where the two lines intersect. This point represents a solution that satisfies both equations.
Types of Systems: Consistent and Inconsistent
A system of equations can be classified as consistent or inconsistent. A system is consistent if it has at least one solution. A system is inconsistent if it has no solutions. When solving systems of equations by graphing, it is possible to determine whether a system is consistent or inconsistent by looking at the intersection point of the two lines. If the lines intersect at a point, the system is consistent and has one solution. If the lines are parallel, the system is inconsistent and has no solution. If the lines coincide, the system is consistent and has infinitely many solutions.
In conclusion, solving systems of equations by graphing is a graphical method that can be used to find the intersection point of two lines. The intersection point represents a solution that satisfies both equations. It is important to understand the basics of graphing, linear equations and their graphs, interpreting intersection points, and types of systems: consistent and inconsistent. By using a graphing calculator, it is possible to graph linear equations quickly and accurately.
3 Simple Solving Systems of Equations by Graphing Examples
To solve systems of equations by graphing, one must graph each equation on the same coordinate plane and find the point where the two lines intersect. The point of intersection is the solution to the system of equations.
- Graph both equations on the coordinate grid.
- You can use the slope and y-intercept of each equation to graph them on the grid.
- Once both equations are graphed, you need to find the point of intersection (where the equations cross).
- The point of intersection will be an x and y coordinate and it will also be your solution.
Here are a few examples:
Example 1
Solve the system of equations by graphing:
- y = 2x + 1
- y = -x + 3
First, graph each equation on the same coordinate plane. The graph of the first equation is a line with a slope of 2 and a y-intercept of 1. The graph of the second equation is a line with a slope of -1 and a y-intercept of 3.

The point of intersection is (1, 3). Therefore, the solution to the system of equations is x = 1 and y = 3.
Example 2
Solve the system of equations by graphing:
- y = 3x – 2
- y = -x + 5
First, graph each equation on the same coordinate plane. The graph of the first equation is a line with a slope of 3 and a y-intercept of -2. The graph of the second equation is a line with a slope of -1 and a y-intercept of 5.

The point of intersection is (1, 1). Therefore, the solution to the system of equations is x = 1 and y = 1.
Example 3
Solve the system of equations by graphing:
- y = -2x + 4
- y = 2x – 2
First, graph each equation on the same coordinate plane. The graph of the first equation is a line with a slope of -2 and a y-intercept of 4. The graph of the second equation is a line with a slope of 2 and a y-intercept of -2.

The point of intersection is (2, 0). Therefore, the solution to the system of equations is x = 2 and y = 0.
These examples illustrate how to solve systems of equations by graphing. It is important to note that not all systems of equations have a solution, and some systems may have infinitely many solutions.
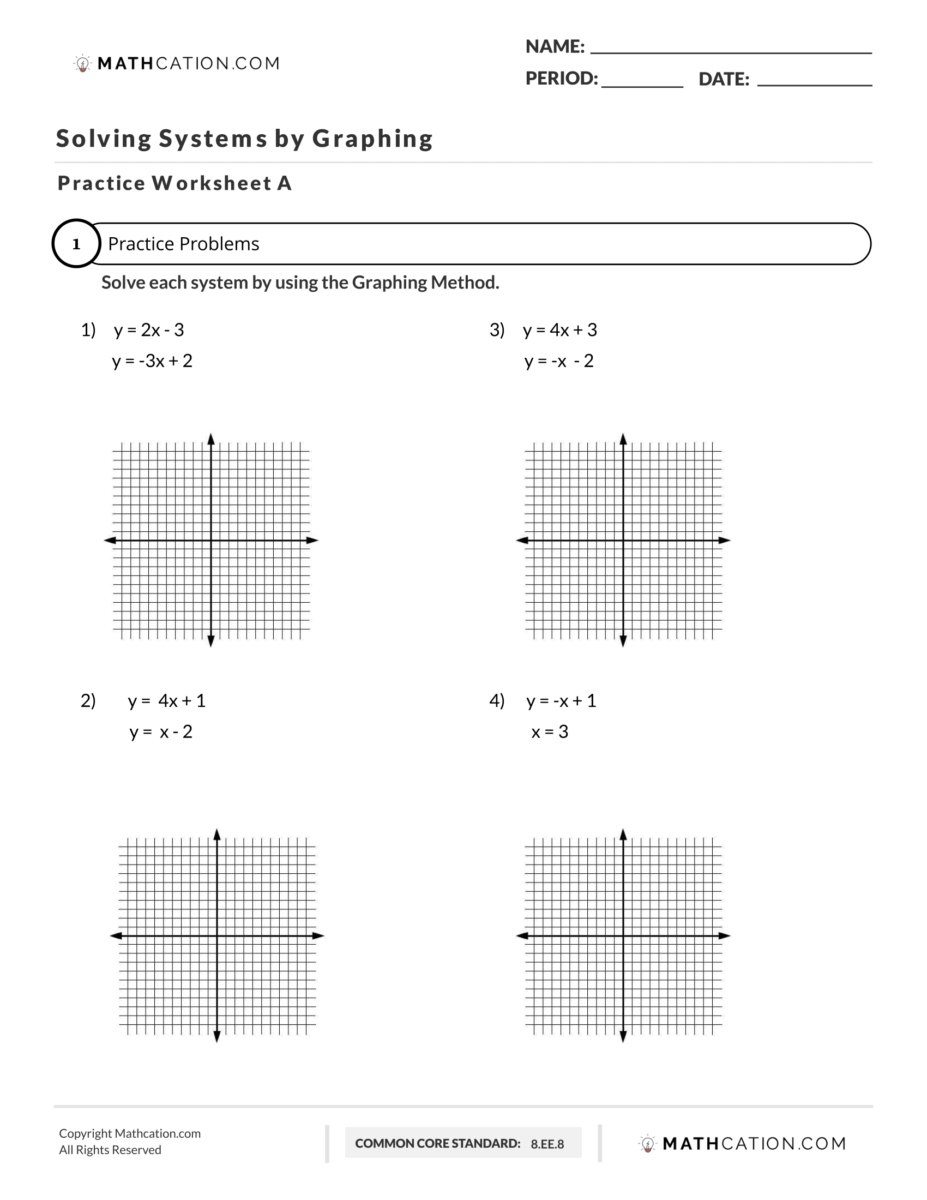
5 Quick Solving Systems by Graphing Practice Problems
Solving Systems of Equations with Graphing FAQ
What is the process for solving systems of equations by graphing?
The process for solving systems of equations by graphing involves graphing each equation on the same coordinate plane and identifying the point of intersection. The point of intersection represents the solution to the system of equations.
How do you graph systems of inequalities?
To graph systems of inequalities, graph each inequality separately and shade the region that satisfies the inequality. The solution to the system of inequalities is the region where the shaded regions overlap.
What is the first step in solving a system of equations by graphing?
The first step in solving a system of equations by graphing is to write the equations in slope-intercept form, y = mx + b. This form makes it easier to identify the slope and y-intercept of each equation, which are needed to graph the equations.
How do you find the solution of a linear system by graphing?
To find the solution of a linear system by graphing, identify the point of intersection of the two lines. The coordinates of the point of intersection represent the solution to the system of equations.
What is the step-by-step process for solving systems of equations by graphing?
The step-by-step process for solving systems of equations by graphing involves the following steps:
- Write the equations in slope-intercept form.
- Graph each equation on the same coordinate plane.
- Identify the point of intersection of the two lines.
- Check the solution by substituting the coordinates of the point of intersection into each equation.
How can a graphing calculator be used to solve a system of equations?
A graphing calculator can be used to solve a system of equations by graphing the equations and using the calculator’s intersect feature to find the point of intersection. This feature allows the user to find the coordinates of the point of intersection without manually graphing the equations.
How do you solve a system of equations by graphing in slope intercept form?
To solve a system of equations by graphing in slope-intercept form, follow the step-by-step process outlined above. Write each equation in slope-intercept form, graph the equations on the same coordinate plane, identify the point of intersection, and check the solution.
Solving Systems of Equations by Graphing Worksheet Video Explanation
Watch our free video on how to solve Systems of Equations by Graphing. This video shows how to solve problems that are on our free Graphing Systems of Equations worksheet that you can get by submitting your email above.
Watch the free Solving Systems of Equations Graphing video on YouTube here: How to Solve Systems of Equations by Graphing
Video Transcript:
This video is about solve system of equations by graphing. You can get the solving system of equations by graphing worksheet we use in this video for free by clicking on the link in the description below.
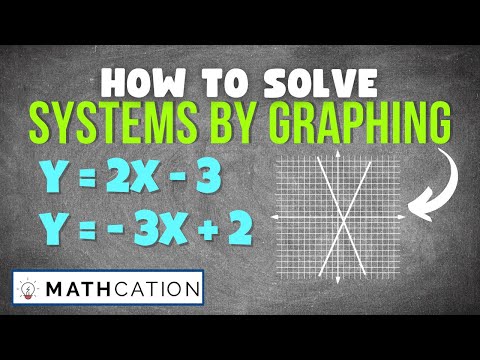
The first problem in our solving systems of equations by graphing worksheet gives us y equals 2x minus 3 and then y equals negative 3x plus 2. We’re looking for the solution of these two equations and the system that they make. What that means is we are looking for the point of intersection of the two equations and to solve by graphing. For example this isn’t the answer but for example if we had our graph here and we had one equation that went this way and the other equation that when you graphed it went like this, the solution to that equation would be the point of intersection. It’s the point that satisfies both equations, which would be the point that the two equations cross.
In order to solving system of equations by graphing you have to graph both equations and then you have to find the point of intersection on the graph and then that coordinate will be your answer. In order to find the point of intersection we have to first graph both equations these equations are written in slope-intercept form, which means you can use the slope and you can use the y-intercept to graph them.
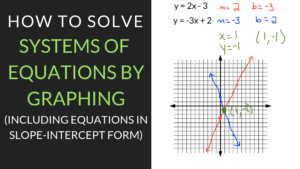
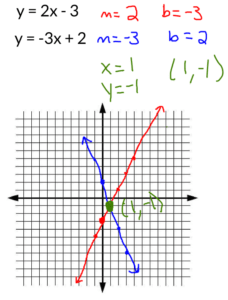
In the case of the first one we know that slope-intercept form is y equals MX plus B, we know M is the slope because it’s always with the X and we know that B is the y-intercept. In the case of this equation M which is the slope is 2 and then B which is the y-intercept is negative 3, and we’re going to graph this equation in red. We have the y-intercept of negative 3 and the slope of 2. We will go down to negative 3 for the y-intercept, which is right here and then we will follow the slope which is 2 or the rise over the run, which is 2 over 1. You go up 2 and then over 1. We’ll start at our y-intercept and we’ll go up 2 over 1 I’ll go up 2 over one and so on.
Then we have to do the same thing for y equals negative 3x plus two. We have to find the slope and the y-intercept and then graph it. In this case the slope is negative 3 and then the y-intercept is positive 2. We’re going to start our y-intercept which is 2. We go up to 2 and then we’re going to graph with our slope which is negative 3. Negative 3 over 1 or down 3 and then over 1. We’ll start at our point we’ll go down 1 2 3 over 1 down 1 2 3 over 1 and we’ll graph then once we have a couple points we can go ahead and connect them. This is our second equation which is in blue.
Now the solution to our system here is going to be the point of intersection, which is right here. It’s the only point that would be true for both equations or that would satisfy the system. This point here is X is 1 Y is negative 1. Our solution to the system of equations is x equals 1 and y equals negative 1. And then in coordinates it would be 1 negative 1 and that’s the solution.
Number three on the solving systems by graphing worksheet gives us our system which in this case is y equals 4x plus 3 and the second equation is y equals negative x minus 2. For this problem of systems of equations with graphing, we have to do the same thing we did in the other problem. We’re going to go ahead and we’re going to find the slope and the y-intercept for each equation.
The slope for y equals 4x plus 3 is 4 and then the y-intercept is positive 3 and then for the second equation we have y equals negative x minus 2. Our slope is even though it’s negative x what that’s like saying is that it’s actually like saying negative 1x. It’s not written but there is a one right there. That’s really negative 1x and then our y-intercept is negative two.
We’re going to go ahead and graph these. I’m gonna graph the first one in red. Our y-intercept for the first one is 3. We will go to our y axis and we’ll plot 3 and then the slope is 4. We will go up 4 and then over 1. We’ll go up 1 2 3 4 over 1 4 over 1 would be right here you could also go backwards so we’ll go down 1 2 3 4 and then this way. You can go in the negative direction and then you can go ahead and graph that equation or draw our line.
I should say then we’re gonna do the same thing for the blue equation which is y equals negative x minus 2. We’ll start at negative 2 which is right here our slope is negative 1x. We will go down 1 this time and then over 1. We’re going to go down 1 over 1 down 1 over 1 which goes in this direction and then you can always go backwards. You go up and left instead of down and right we’ll go this way. And then once we have our points plotted we can go ahead and draw our line.
And then once again in order to solve systems of equations by graphing you have to find the point of intersection between the equations. Our point of intersection is right there. It’s the spot where the two lines cross, in this case that would be negative 1 negative 1. X is negative 1 Y is negative 1. The solution X would be negative 1 Y would be negative 1 and in the terms of coordinates the solution would be negative 1 negative 1. Try all these practice problems by downloading the free solve systems by graphing worksheet above.
Free Graphing Systems of Equations worksheet download
Enter your email to download the free Graphing Systems of Equations worksheet
Practice makes Perfect.
We have hundreds of math worksheets for you to master.
Share This Page