
Line of Best Fit Worksheet, Formula, and Equation
Get the free Line of Best Fit worksheet pdf and other resources for teaching & understanding solving Line of Best Fit

Key Points about the Line of Best Fit
- The line of best fit is a straight line that represents the trend of a set of data points.
- It is used to predict future values and identify patterns and relationships between variables.
- The equation of the line of best fit is y = mx + b, where m is the slope and b is the y-intercept.
What is the Line of Best Fit?
The Line of Best Fit is a line drawn onto the graph of a set of data. The Line of Best Fit Definition is a linear line drawn on the graph as close to all the points as possible. The Line of Best Fit may cross all the points, some points, or no points. Ideally, you would like to have half of the points on one side of the Line of Best Fit and half of the points on the other side. You can find the Line of Best Fit Equation by looking at its graph and writing the equation in Slope-Intercept Form. The easiest way to do this is to find the y-intercept of the Line of Best Fit and then finding its slope.
The line of best fit is a fundamental concept in statistics and mathematics. It is a straight line that best represents the trend of a set of data points. The line of best fit is used to predict future values based on past data and to identify patterns and relationships between variables. It is widely used in various fields, including science, engineering, finance, and social sciences.
The line of best fit is defined as the line that minimizes the sum of the squared distances between each data point and the line. It is also known as the least squares regression line. The equation of the line of best fit is y = mx + b, where m is the slope of the line and b is the y-intercept. The slope of the line represents the rate of change of the dependent variable with respect to the independent variable, while the y-intercept represents the value of the dependent variable when the independent variable is zero.
Common Core Standard: 8.SP.3
Related Topics: Scatter Plots
Return To: Home, 8th Grade
Line of Best Fit Definition
A line of best fit is a straight line that represents the trend of a set of data in a scatter plot. It is also known as a trend line or regression line. The line of best fit is used to estimate the relationship between two variables by minimizing the distance between the line and the data points. This line is used to make predictions about future data points that are not yet available.
Representation on a Graph
The line of best fit is represented on a graph by plotting the data points on the x and y axes. The line is then drawn through the data points in a way that minimizes the distance between the line and the points. This is done by finding the slope and y-intercept of the line that best fits the data.
The slope of the line of best fit represents the rate of change between the two variables. If the slope is positive, then the two variables are positively correlated, meaning that as one variable increases, the other variable also increases. If the slope is negative, then the two variables are negatively correlated, meaning that as one variable increases, the other variable decreases.
The y-intercept of the line of best fit represents the value of the dependent variable when the independent variable is equal to zero. This value can be used to make predictions about the dependent variable when the independent variable is not yet known.
In summary, the line of best fit is a useful tool for estimating the relationship between two variables in a scatter plot. It helps to make predictions about future data points and is represented on a graph by finding the slope and y-intercept of the line that best fits the data.
Line of Best Fit Equation
The line of best fit is a straight line that best represents the trend of the data points on a scatter plot. It is also known as the regression line, and it is used to predict the value of the dependent variable based on the value of the independent variable. The equation of the line of best fit is a mathematical expression that describes the relationship between the variables.
Slope
The slope of the line of best fit is a measure of the rate of change of the dependent variable with respect to the independent variable. It is defined as the change in the y-coordinate divided by the change in the x-coordinate between any two points on the line. The slope is denoted by the letter m.
Y-Intercept
The y-intercept of the line of best fit is the value of the dependent variable when the independent variable is zero. It is denoted by the letter b.
Equation
The equation of the line of best fit is in the form of y = mx + b, where y is the dependent variable, x is the independent variable, m is the slope, and b is the y-intercept. The equation can be used to predict the value of y for any given value of x.
To find the equation of the line of best fit, first calculate the slope and y-intercept using the formulas above. Then substitute the values of m and b into the equation y = mx + b. The resulting equation represents the line of best fit.
In summary, the line of best fit equation is a mathematical expression that describes the relationship between the variables. It consists of a slope and a y-intercept, which can be calculated using specific formulas. The equation is in the form of y = mx + b, and it can be used to predict the value of the dependent variable for any given value of the independent variable.
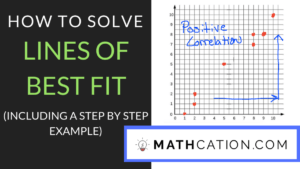
2 Simple Line of Best Fit Examples
Steps for solving Line of Best Fit example above:
- Draw the Line of Best Fit on the Scatter Plot.
- When drawing the Line of Best Fit make sure it is as close to all of the points as possible.
- After the line is drawn you need to write the equation of the line in Slope-Intercept Form.
- Find the slope and plug it in for m.
- Find the y-intercept and plug it in for b.
Predicting Future Trends
One of the most common applications of the line of best fit is to predict future trends. By analyzing the trend of a set of data points, it is possible to make predictions about what may happen in the future. For example, a business owner may use the line of best fit to predict future sales based on past sales data. By analyzing the trend of sales over time, they can make informed decisions about inventory and marketing strategies.
Real-Life Examples
Real-life examples of the line of best fit can be found in a variety of fields. In finance, the line of best fit is often used to analyze stock prices and predict future market trends. In healthcare, it can be used to analyze patient data and predict future health outcomes. In sports, it can be used to analyze player statistics and predict future performance.
One example of the line of best fit in action is in the field of meteorology. By analyzing past weather data, meteorologists can use the line of best fit to predict future weather patterns. This information is critical for planning and preparing for severe weather events.
Another example of the line of best fit in action is in the field of education. Teachers can use the line of best fit to analyze student performance data and predict future academic outcomes. This information can be used to adjust teaching strategies and provide additional support to students who may be struggling.
Overall, the line of best fit is a powerful tool for analyzing trends and predicting future outcomes. By using this tool, individuals and organizations can make informed decisions based on data-driven insights.
5 Quick Line of Best Fit Practice Problems
How to Draw a Line of Best Fit
Drawing a line of best fit is a common statistical technique used to identify the relationship between two variables. It is a straight line that best approximates the data points on a scatter plot. This section will explain how to draw a line of best fit and its significance in data analysis.
How it Approximates
The line of best fit is drawn by minimizing the sum of the squared deviations between the line and the data points. The deviations are the differences between the observed values and the predicted values on the line of best fit. The line of best fit is also known as the regression line, and the process of drawing it is called regression analysis.
To draw a line of best fit, one needs to plot the data points on a scatter plot. Then, the line of best fit is drawn so that it passes through the middle of the data points. The line should be drawn in such a way that it minimizes the distance between the line and the data points.
Understanding Deviation
The deviation is the difference between the observed value and the predicted value on the line of best fit. The deviation can be positive or negative. If the deviation is positive, it means that the observed value is higher than the predicted value. If the deviation is negative, it means that the observed value is lower than the predicted value.
The line of best fit is drawn so that it minimizes the sum of the squared deviations. This means that the line of best fit is the line that is closest to the data points. The closer the line of best fit is to the data points, the smaller the sum of the squared deviations.
In conclusion, drawing a line of best fit is an essential technique in data analysis. It helps to identify the relationship between two variables and to make predictions based on the data. The line of best fit is drawn by minimizing the sum of the squared deviations between the line and the data points.
How to Find Line of Best Fit
Understanding Regression Analysis
Regression analysis is a statistical method used to determine the relationship between one or more independent variables and a dependent variable. It is commonly used in research to identify patterns and trends in data. Regression analysis can be used to predict future outcomes based on past data.
Dependent and Independent Variables
In regression analysis, the dependent variable is the variable that is being predicted. The independent variable is the variable that is used to predict the dependent variable. For example, if you are trying to predict a person’s weight based on their height, weight is the dependent variable and height is the independent variable.
Linear Regression vs Multiple Regression
Linear regression is a type of regression analysis that is used to determine the relationship between two variables. It is used when there is a linear relationship between the variables. Multiple regression is used when there are more than two independent variables. It is used to determine the relationship between the dependent variable and multiple independent variables.
To find the line of best fit using linear regression, the following steps can be taken:
- Plot the data points on a graph.
- Determine the independent variable (x-axis) and the dependent variable (y-axis).
- Draw a line that best fits the data points. The line should pass through as many points as possible.
- Calculate the equation of the line using the formula y = mx + b, where m is the slope of the line and b is the y-intercept.
- Use the equation of the line to predict future outcomes based on past data.
In summary, finding the line of best fit using regression analysis involves identifying the dependent and independent variables, selecting the appropriate regression method, and calculating the equation of the line. It is a powerful tool that can be used to identify patterns and trends in data and to make predictions about future outcomes.
Line of Best Fit Formula
The line of best fit is a straight line that best represents the data on a scatter plot. It is used to determine the relationship between two variables, such as the relationship between height and weight or the relationship between temperature and pressure. The formula for the line of best fit is commonly used in statistics and is also known as the least squares method.
The formula for the line of best fit is y = mx + b, where y is the dependent variable, x is the independent variable, m is the slope of the line, and b is the y-intercept. The slope of the line represents the rate of change of the dependent variable with respect to the independent variable, while the y-intercept represents the value of the dependent variable when the independent variable is zero.
To find the slope of the line of best fit, the formula is:
Once the slope and y-intercept of the line of best fit are calculated, the equation for the line can be written as y = mx + b. This equation can then be used to make predictions about the dependent variable based on the independent variable.
It is important to note that the line of best fit is not always a perfect representation of the data and there may be some error involved in using it to make predictions. However, it is a useful tool for understanding the relationship between two variables and making predictions based on that relationship.
Line of Best Fit Graph FAQ
How do you determine the slope of the line of best fit?
To determine the slope of the line of best fit, one needs to use the formula y = mx + b, where “m” is the slope of the line. The slope of the line of best fit represents the rate of change between the dependent and independent variables.
What is the purpose of the line of best fit?
The line of best fit is used to represent the trend of the data points in a scatter plot. It helps to identify the relationship between the dependent and independent variables and to make predictions based on the data.
What is the difference between a positive and negative slope in a line of best fit?
A positive slope in the line of best fit indicates that there is a positive relationship between the dependent and independent variables. This means that as the independent variable increases, the dependent variable also increases. A negative slope indicates the opposite relationship.
How do you interpret the equation of the line of best fit?
The equation of the line of best fit is in the form y = mx + b, where “m” is the slope of the line and “b” is the y-intercept. The slope represents the rate of change between the dependent and independent variables, while the y-intercept represents the value of the dependent variable when the independent variable is equal to zero.
What are the limitations of using a line of best fit?
The line of best fit assumes that there is a linear relationship between the dependent and independent variables. It may not accurately represent the data if there is a non-linear relationship. Additionally, outliers can significantly affect the line of best fit.
How do outliers affect the line of best fit?
Outliers are data points that are significantly different from the other data points in the scatter plot. They can significantly affect the line of best fit by pulling it towards them. As a result, the line of best fit may not accurately represent the trend of the data points.
What is the line of best fit in a scatter plot?
The line of best fit is a straight line that represents the trend of the data points in a scatter plot. It is determined by minimizing the sum of the squared distances between the data points and the line. The line of best fit helps to identify the relationship between the dependent and independent variables and to make predictions based on the data.
Line of Best Fit Worksheet Video Explanation
Watch our free video on how to find the Line of Best Fit Equation. This video shows how to solve problems that are on our free Line of Best Fit worksheet answer key that you can get by submitting your email above. The video also explains the Line of Best Fit Definition in detail.
Watch the free Line of Best Fit video on YouTube here: Line of Best Fit
Video Transcript:
In this video we’re going to show you how to draw line of best fit by working on some of our practice problems from our line of best fit practice worksheet.
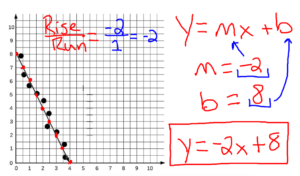
Let’s jump right in looking at number one on the writing equations for line of best fit worksheet. Our directions say write the equation of the lines of best fit in slope intercept form for each scatter plot. In order to do this the first thing we need to understand is that we’re talking about slope intercept form and our lines of best fit has to be written in that form. Slope intercept form is equal to y equals MX plus B.
Typically this is the most common way you will see linear equations written. In the case of slope intercept form M is equal to the slope and B is equal to the y-intercept or where it crosses the y axis. If we look at number one, number one has a scatter plot drawn and it also has a lines of best fit already drawn through the scatter plot. If you look the easiest thing to identify is the y intercept that’s because all you have to do is see where the lines crosses the y axis, this vertical line here of course is the y axis and our lines of best fit crosses the y axis right there which is at 8.
We already know our y intercept which is 8, the next thing we have to find is our slope. Slope is equal to the rise divided by the run, so in order to find the rise divided by the run we have to find two points that are exactly on the line that intersect the grid perfectly. If we look we already have our first point which is our y intercept, so it’s already there. Then if you look really closely at our line you will see that you can pick points that cross the grid perfectly or where our line intersects the grid of the actual graph, so all these points actually intersect the line and the grid so right here.
Then the next thing you need to do is you need to find the rise and the run so what we’re going to do is we’re going to go from one point to the next. So we’re just going to draw all lines and we’ll just do a couple there. What we do is we count how much we rise or drop and how much we go over. If we go down to so this is negative two because we’re going down two and if you look at each step each step is exactly the same down to so this negative two or this up-and-down motion is our rise. We know a rise is negative two then we have to find the run or how much we go over by. In case of this example we go over one here and we go over one here then we go over one here so a run is going to be one, and then if you simplify this negative 2 divided by 1 is just negative 2. So our slope is negative 2.
Then the last step is that you have to take each part which is slope and y-intercept and you have to substitute it back into slope intercept form. We know that our slope is negative 2 so we will substitute in negative 2 for M and then we know that y intercept is 8 so we will substitute an 8 for the y intercept. So our equation in slope intercept form for this lines of best fit is y equals negative 2x plus 8. These are just a couple example problems from the line of best fit practice worksheet that you can download above.
Free Line of Best Fit worksheet download

Enter your email to download the free Lines of Best Fit worksheet
Practice makes Perfect.
We have hundreds of math worksheets for you to master.
Share This Page