
Graphing Slope Intercept Form Worksheet, Examples, and Calculator
Get the free Graphing Slope Intercept Form worksheet and other resources for teaching & understanding solving Graphing Slope Intercept Form

Key Points about Graphing in Slope Intercept Form
- Slope Intercept Form is a method of writing the equation of a line in the form y = mx + b, where m is the slope and b is the y-intercept.
- To graph a line in Slope Intercept Form, one can use the slope and y-intercept to plot two points on the coordinate plane and then draw a straight line that passes through them.
- Graphing Slope Intercept Form is a fundamental concept in algebra that is often taught in middle and high schools.
Graphing an Equation in Slope Intercept Form
Graphing in Slope Intercept Form is the easiest way to graph linear equations. Graphing in Slope Intercept Form is convenient because Slope Intercept Form already has the slope and y-intercept built into the form which means you just have to know how to use them. The first thing you do when solving how to Graph in Slope Intercept Form is to plot the y-intercept of the equation. The y-intercept is where the equation crosses the y-axis. Next, you use the slope to plot the next point on the line. If the slope is positive, then your line will be increasing from left to right. If the slope is negative, then your line will be decreasing from left to right.
Graphing Slope Intercept Form is a fundamental concept in algebra that is often taught in middle and high schools. It is a method of writing the equation of a line in the form y = mx + b, where m is the slope and b is the y-intercept. This form is particularly useful because it clearly shows the slope and y-intercept of the line, which are two important characteristics that can be used to graph the line.
To graph a line in Slope Intercept Form, one can use the slope and y-intercept to plot two points on the coordinate plane and then draw a straight line that passes through them. The slope, represented by m, is the ratio of the change in y to the change in x, while the y-intercept, represented by b, is the point where the line crosses the y-axis. By plotting these two points and drawing a line between them, one can graph the line in Slope Intercept Form.
In summary, Graphing Slope Intercept Form is a simple and effective way to graph a line in algebra. By using the slope and y-intercept, one can plot two points and draw a straight line that passes through them. This method is widely used in mathematics and is an essential skill for students to learn.
Common Core Standard: 8.F.C.3
Related Topics: Finding Y-Intercept from a Graph and Table, Finding Slope from a Graph, Finding Slope from a Table, Intro to Slope-Intercept Form, Identifying Functions from a Graph and Table
Return To: Home, 8th Grade
What is Slope Intercept Form?
Slope-Intercept Form is a way of writing the equation of a straight line so that it can be easily graphed on a coordinate plane. It is written in the form y = mx + b, where m is the slope of the line and b is the y-intercept.
The slope of a line is the measure of how steep it is, and it is represented by the coefficient of x in the equation. The y-intercept is the point where the line crosses the y-axis, and it is represented by the constant in the equation.
The slope-intercept form is useful because it allows you to graph a line quickly and easily. You can find the y-intercept from the equation, and then use the slope to find other points on the line.
For example, if the equation of a line is y = 2x + 1, the slope of the line is 2, and the y-intercept is 1. This means that the line crosses the y-axis at (0,1), and that for every increase of 1 in x, y increases by 2.
In addition to being easy to graph, the slope-intercept form is also useful for finding the equation of a line from a graph. If you know two points on a line, you can use them to find the slope, and then use the slope and one of the points to find the y-intercept.
Overall, the slope-intercept form is a simple and powerful tool for working with straight lines, and it is used extensively in algebra, geometry, and other fields.
How to Graph Slope Intercept Form
Graphing slope-intercept form is a fundamental skill in algebra and is essential for understanding linear equations. This section will explain how to graph slope-intercept form in three simple steps: plotting the y-intercept, using slope to find additional points, and drawing the line.
Plotting the Y-Intercept
The y-intercept is the point where the line crosses the y-axis. In slope-intercept form, the y-intercept is represented by the constant term, b. To plot the y-intercept, locate the point (0, b) on the coordinate plane. For example, if the equation is y = 2x + 3, the y-intercept is 3, so the point (0, 3) is plotted.
Using Slope to Find Additional Points
The slope of a line is the ratio of the change in y to the change in x, or rise over run. In slope-intercept form, the slope is represented by the coefficient of x, m. To find additional points on the line, use the slope to move from the y-intercept to other points. For example, if the slope is 2, move up 2 units and right 1 unit to find the next point. Repeat this process to find as many points as necessary.
Drawing the Line
Once you have plotted the y-intercept and additional points, draw a straight line through the points. Use a ruler or straightedge to ensure the line is straight. Label the line with its equation, y = mx + b, and include arrows on both ends to indicate that the line continues infinitely in both directions.
In conclusion, graphing slope-intercept form is a simple process that involves plotting the y-intercept, using slope to find additional points, and drawing a line through the points. By following these steps, anyone can graph a linear equation in slope-intercept form with confidence and accuracy.
Slope Intercept Form Definition
Slope-intercept form is a way of writing the equation of a line in the form y = mx + b, where m is the slope of the line and b is the y-intercept. This form is useful because it makes it easy to graph a line, since the slope and y-intercept are readily apparent.
The slope of a line is a measure of how steep it is. It is defined as the change in y divided by the change in x, or rise / run. The y-intercept is the point at which the line crosses the y-axis.
The slope-intercept form is particularly useful for graphing linear equations because it is easy to see the slope and y-intercept. The slope tells you how steep the line is, while the y-intercept tells you where the line crosses the y-axis.
To graph a line using the slope-intercept form, you simply plot the y-intercept on the y-axis, and then use the slope to find additional points on the line. For example, if the slope is 2/3, you can find another point on the line by moving up 2 units and to the right 3 units from the y-intercept.
In summary, the slope-intercept form of a linear equation is a way of writing the equation of a line in the form y = mx + b, where m is the slope and b is the y-intercept. This form is useful for graphing lines because it makes it easy to see the slope and y-intercept, which are important properties of a line.
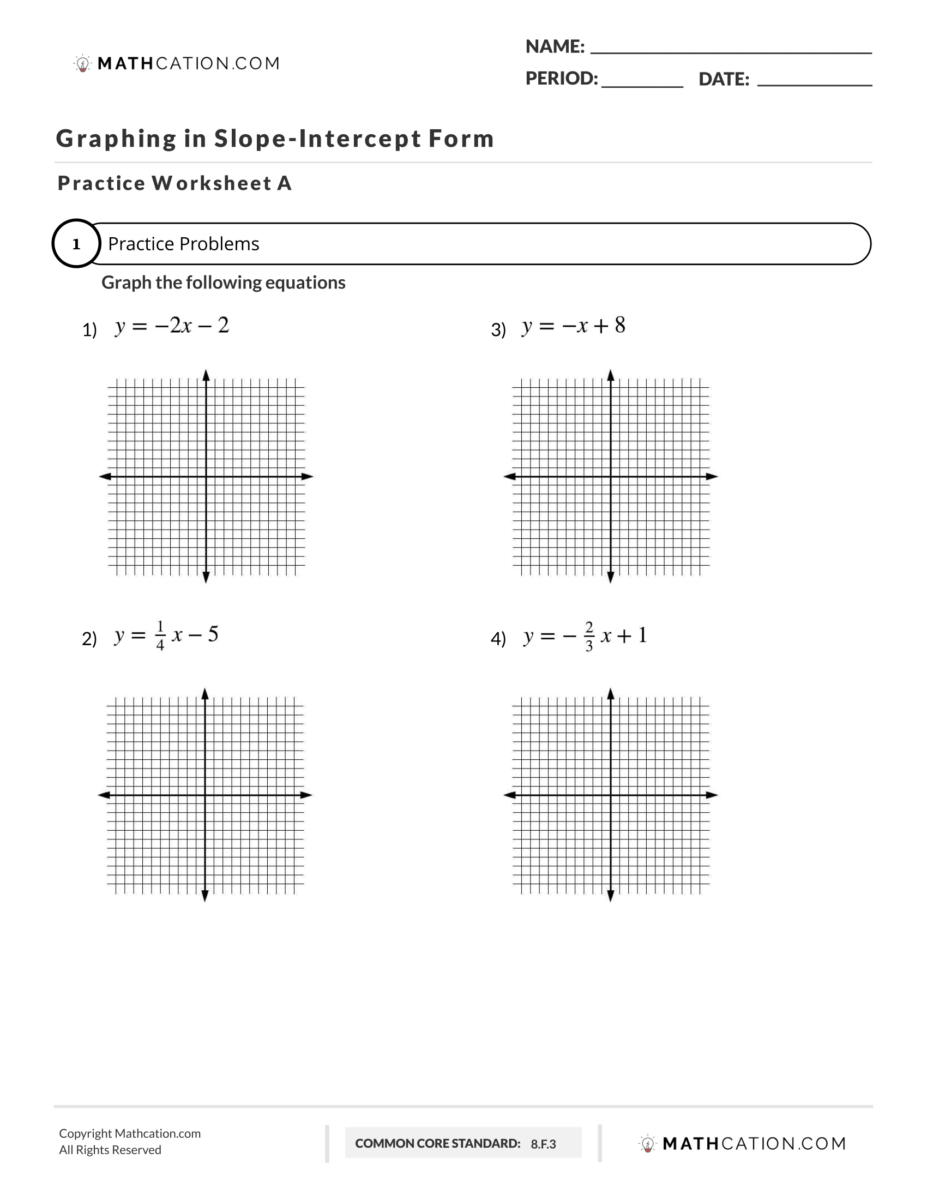
3 Simple Graphing Slope Intercept Form Examples
- Find the slope and y-intercept by looking at the equation of the line.
- Plot the y-intercept on the y-axis. Use the slope to find the next points by using the rise and the run.
- If the Numerator is positive then the line will go up and have a positive slope.
- If the numerator is negative then the line will go down and have a negative slope.
- The denominator tells you how many times you move to the right each time.
Graphing slope intercept form is a common task in algebra that involves plotting a linear equation on a coordinate plane. The slope intercept form of a line is y = mx + b, where m is the slope and b is the y-intercept. In this section, we will look at some examples of graphing slope intercept form.
Example 1
Graph the line y = 2x + 3.
To graph this line, we can use the slope-intercept form to identify the slope and y-intercept. The slope of the line is 2, which means that for every increase of 1 in the x-value, the y-value will increase by 2. The y-intercept of the line is 3, which means that the line will cross the y-axis at the point (0,3).
Using this information, we can plot the point (0,3) on the coordinate plane and then use the slope to find additional points on the line. To find another point, we can move 1 unit to the right and 2 units up from the point (0,3) to get the point (1,5). We can continue this process to plot more points and draw the line.
Example 2
Graph the line y = -1/2x + 4.
To graph this line, we can again use the slope-intercept form to identify the slope and y-intercept. The slope of the line is -1/2, which means that for every increase of 1 in the x-value, the y-value will decrease by 1/2. The y-intercept of the line is 4, which means that the line will cross the y-axis at the point (0,4).
Using this information, we can plot the point (0,4) on the coordinate plane and then use the slope to find additional points on the line. To find another point, we can move 2 units to the right and 1 unit down from the point (0,4) to get the point (2,3). We can continue this process to plot more points and draw the line.
Example 3
Graph the line y = -3x.
To graph this line, we can again use the slope-intercept form to identify the slope and y-intercept. The slope of the line is -3, which means that for every increase of 1 in the x-value, the y-value will decrease by 3. Since there is no y-intercept, the line does not cross the y-axis.
Using this information, we can plot the point (0,0) on the coordinate plane, which is the origin. We can then use the slope to find additional points on the line. To find another point, we can move 1 unit to the right and 3 units down from the point (0,0) to get the point (1,-3). We can continue this process to plot more points and draw the line.
In conclusion, graphing slope intercept form is a straightforward process that involves identifying the slope and y-intercept of a line and using that information to plot points and draw the line on a coordinate plane.
What is m in Slope Intercept Form?
Slope-Intercept Form is a way to represent the equation of a line in the form of y = mx + b, where m is the slope of the line and b is the y-intercept. In this section, we will explore the definition of slope, positive and negative slope, and how it relates to the slope-intercept form.
Definition of Slope
Slope is the measure of the steepness of a line. It is defined as the ratio of the change in y over the change in x. Mathematically, it can be represented as:
m = (y2 - y1) / (x2 - x1)
where (x1, y1) and (x2, y2) are two points on the line. Slope can be positive, negative, or zero.
Positive and Negative Slope
A line with a positive slope rises from left to right, while a line with a negative slope falls from left to right. A horizontal line has a slope of zero, and a vertical line has an undefined slope.
When the slope is positive, it means that as x increases, y also increases. Conversely, when the slope is negative, it means that as x increases, y decreases. This relationship between x and y is what gives the line its steepness.
Increasing x and Negative Slope
When the slope is negative, it means that as x increases, y decreases. This relationship can be seen in the graph of a line with a negative slope. As x increases, the line falls from left to right.
In conclusion, the slope (m) in the slope-intercept form of a line represents the steepness of the line. A positive slope indicates that as x increases, y also increases, while a negative slope indicates that as x increases, y decreases. Understanding the slope is essential in graphing and interpreting the equation of a line.
What is b in Slope Intercept Form?
In slope-intercept form, the equation of a line is represented as y = mx + b, where m is the slope and b is the y-intercept. The y-intercept is the point where the line crosses the y-axis.
Y-Intercept
The y-intercept is the value of y when x is equal to zero. It is the point where the line intersects the y-axis. The value of b in the equation y = mx + b represents the y-intercept.
For example, if the equation of a line is y = 2x + 3, then the y-intercept is 3. This means that the line crosses the y-axis at the point (0,3).
The y-intercept is an important parameter in the slope-intercept form of a line. It gives us information about where the line intersects the y-axis and helps us to graph the line.
In summary, b in slope-intercept form represents the y-intercept of a line. It is the value of y when x is equal to zero and is an important parameter in graphing a line.
How to Graph a Line with an Equation
Graphing a line with an equation in slope-intercept form is a simple and straightforward process. By following a few simple steps, anyone can graph a line with ease.
- Identify the slope and y-intercept of the line. The slope is represented by “m” and the y-intercept is represented by “b” in the equation y = mx + b.
- Plot the y-intercept on the y-axis. The y-intercept is the point where the line crosses the y-axis. For example, if the y-intercept is (0, 3), plot the point (0, 3) on the y-axis.
- Use the slope to find additional points on the line. The slope tells you how the line changes as you move from left to right. For example, if the slope is 2, for every one unit you move to the right, you move up two units. Use this information to find additional points on the line.
- Plot the additional points on the graph. Once you have found additional points on the line, plot them on the graph. Connect the points with a straight line to complete the graph.
It’s important to remember that the slope tells you how steep the line is, and the y-intercept tells you where the line crosses the y-axis. By understanding these concepts and following the steps outlined above, anyone can graph a line with an equation in slope-intercept form.
Additionally, it’s helpful to remember that the slope can be positive, negative, zero, or undefined. A positive slope means the line goes up as you move from left to right, a negative slope means the line goes down as you move from left to right, a zero slope means the line is horizontal, and an undefined slope means the line is vertical.
Graphing Slope Intercept Form Calculator
Graphing slope-intercept form equations can be a bit tricky, especially when working with multiple variables. Fortunately, there are many online calculators available to help with this process. These calculators allow users to input the slope and y-intercept values and then generate a graph of the equation.
One such calculator is the Slope Intercept Form Calculator from Symbolab. This calculator is easy to use and provides step-by-step solutions for finding the slope and y-intercept of a given equation. It also allows users to graph the equation by simply clicking a button.
Another useful calculator is the Slope Intercept Form Calculator from Omni Calculator. This calculator allows users to input two points on a graph and then generates the slope and y-intercept values. It also provides a graph of the equation, making it easy to visualize the line.
Users can also use the Desmos Graphing Calculator to graph slope-intercept form equations. This calculator allows users to input the equation directly into the calculator and then generates a graph of the equation. It also provides options for customizing the graph, such as changing the color and style of the line.
In addition to these calculators, there are also many mobile apps available for graphing slope-intercept form equations. These apps can be especially useful for students who need to graph equations on-the-go.
Overall, graphing slope-intercept form equations can be made much easier with the use of online calculators and mobile apps. These tools allow users to quickly and accurately graph equations, making it easier to visualize and understand the relationship between the variables in the equation.
Graphing Slope Intercept Form FAQ
How do I graph a linear equation in slope-intercept form?
To graph a linear equation in slope-intercept form, first identify the y-intercept, which is the point where the line intersects with the y-axis. The y-intercept is represented by the constant term, b, in the equation y = mx + b. Then, use the slope, m, to find additional points on the line. The slope is the coefficient of x in the equation. To find another point on the line, move m units up or down (depending on the sign of m) from the y-intercept and then move one unit to the right. Connect the points to graph the line.
How do I find the slope and y-intercept of a line given in slope-intercept form?
In a linear equation in slope-intercept form, the slope is the coefficient of x and the y-intercept is the constant term. So, for the equation y = mx + b, the slope is m and the y-intercept is b.
What is the equation of a line in slope-intercept form?
The equation of a line in slope-intercept form is y = mx + b, where m is the slope of the line and b is the y-intercept.
How do I use a graphing calculator to graph a line in slope-intercept form?
To graph a line in slope-intercept form using a graphing calculator, enter the equation into the calculator and choose the graphing function. The calculator will then plot the line on the coordinate plane.
How do I determine the slope and y-intercept of a line from its graph?
To determine the slope and y-intercept of a line from its graph, identify two points on the line and use the slope formula: m = (y2 – y1) / (x2 – x1), where (x1, y1) and (x2, y2) are the coordinates of the two points. The y-intercept is the point where the line intersects with the y-axis.
What is the point-slope form of a linear equation?
The point-slope form of a linear equation is y – y1 = m(x – x1), where (x1, y1) is a point on the line and m is the slope of the line.
How do you do an equation in slope intercept form?
To write an equation in slope-intercept form, solve for y so that the equation is in the form y = mx + b, where m is the slope and b is the y-intercept.
What is an example of a slope-intercept form?
An example of a linear equation in slope-intercept form is y = 2x + 3, where the slope is 2 and the y-intercept is 3.
Graphing Slope Intercept Form Worksheet Video Explanation
Watch our free video on how to do Slope Intercept Form. This video shows how to solve problems that are on our free Graph Slope Intercept Form worksheet that you can get by submitting your email above.
Watch the free video on YouTube here: Graphing Slope Intercept Form
Video Transcript:
This video is about how to graph slope intercept form. You can get the graphing slope-intercept form worksheet used in this video for free by clicking on the link in the description below.
This video is about graphing slope intercept form. This means that all of our equations are written in y=mx+b form, where m is the slope and b is the y-intercept. We will explain how to graph using slope intercept form, how to graph a slope, and how to graph slope and y intercept. If we look at our equation we already know the slope and we already know the y-intercept.
In order to identify them you only have to look at the location of the terms in the equation. We know that slope has to be attached to the X, it’s the coefficient of the X. We know that our slope is going to be this negative 2. Our M is negative 2 and then we also know that the y-intercept is the constant at the end or the beginning of the equation. In this case it’s at the end. We know our B is also negative 2.
Now you will remember that slope is equal to the rise divided by the run. Our slope is negative 2 and in order to understand the rise over the run you have to remember that all whole numbers are written over 1. All whole numbers really have this one under them even though we don’t always write it. In terms of slope, if the slope is negative 2 that means this top part is our rise and this bottom part is the run because we know that the slope is the rise divided by the run. In the case of this example, like I said our rise is negative 2 and our run is 1. What this means is when we move from one point to the next we’re going to go down 2 because it’s negative and then right 1 because this one is positive.
Starting with number 1 on the graph slope-intercept form worksheet, when we graph our line we’re going to start at our intercept now the y-intercept is negative two and that’s where it crosses the y axis. We’re going to put our first point right here at negative two we’ll go to the origin and then we’ll go down to negative two and that will be our y intercept. Now in order to find the next point we know that the slope is also negative two, and what that means is we will go down 2 and over 1 each time we move.
We’ll start at this point we’re going to go down 2 spaces. Here’s one space and then here’s two spaces and then over one. We’ll go over to here right here and that’s going to be our next point right there, then we’re going to repeat. We’ll go down two and then over one and our next point will be right here and so on. In order to get our line all we have to do is connect the points. We’re going to start up here and we will go down and connect all these points together and this is going to be the graph of our equation.
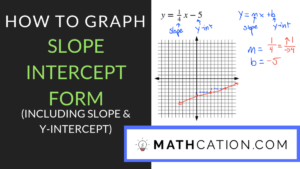
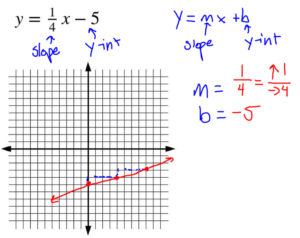
Moving on to the second problem for graphing slope intercept form our equation is y equals one-half X minus five. We know that our equation is already written in slope intercept form which is y equals MX plus B and we know that M is the slope and we know that B is the y-intercept. In order to graph this we need to first identify the slope and also we have to identify the y-intercept. Slope will be the coefficient on the X, in this case our slope is 1/4 because that’s the coefficient on the X.
We know that M is 1/4 and then our y-intercept will be the constant that is not attached to the X, in this case it’s negative 5. Our y-intercept will be negative 5 now we know that slope is the rise divided by the run. We already have our slope which was ¼. We know that 1 is the rise and we know that 4 is the run one is positive so we will go up 1 because that’s the rise and then the run is positive 4 which means it will move to the right 4.
In order to graph this we will start at our y-intercept. Y-intercept right here is negative 5 so we will go to the y-axis and we will go down to negative 5 which is right here. Then we’re going to use our slope to find the next point. Our slope tells us we go up one and over 4 to get to the next point. We will start at our y-intercept and we will go up 1 and then over 4 and that’s going to be our next point right here.
Then we’re going to do it again we will go up 1 and then over 4 again and that’s going to be our next point. Then in order to graph our equation you just connect the dots. We go here connecting the dots and then you can sort of go in this direction as well and that’s going to be the graph of this equation in slope intercept form. Try all the practice problems by downloading the free graphing from slope intercept form worksheet above.
Free Graphing Slope Intercept Form worksheet download
Enter your email to download the free Graphing Slope Intercept Form worksheet
Practice makes Perfect.
We have hundreds of math worksheets for you to master.
Share This Page