
How to find Slope of a Table: 3 Tricks that Work
Get the free How to Find Slope of a Table worksheet and other resources for teaching & understanding How to Find Slope of a Table

Key Points about finding Slope of a Table
- Slope is the measure of the steepness of a line, and it is calculated by dividing the change in the y-coordinates by the change in the x-coordinates.
- To find the slope of a table, it is important to identify the x-coordinates and the y-coordinates of two points on the table.
- Tables can represent different types of slopes, including positive, negative, zero, and undefined slopes.
How to find Slope from a Table
Finding Slope from a Table relies on knowing that Slope is a ratio between the difference in the y-values divided by the difference in the x-values. When finding the slope, you must first find the difference in y-values in the table. You must then find the difference in the x-values in the table. The last step is to divide the difference in the y-values by the difference in the x-values. Anytime you Find Slope from Table you must reduce the fraction if it can be reduced. Download the free Slope from Tables worksheet by clicking on the link on the right side of this page.
Finding the slope of a table is a fundamental concept in algebra. Slope is the measure of the steepness of a line, and it is calculated by dividing the change in the y-coordinates by the change in the x-coordinates. A table can be used to represent a set of data points, and finding the slope of the table can help determine if the data points represent a linear function.
To find the slope of a table, it is important to identify the x-coordinates and the y-coordinates of two points on the table. Once the coordinates are identified, the slope can be calculated by dividing the change in the y-coordinates by the change in the x-coordinates. This process can be repeated for different pairs of points to determine if the data points represent a linear function.
It is important to note that tables can represent different types of slopes, including positive, negative, zero, and undefined slopes. Understanding the different types of slopes can help in identifying and interpreting data points. By following a few simple steps, anyone can find the slope of a table and use it to make informed conclusions about the data.
Common Core Standard: 8.F.B.4
Related Topics: Finding Y-Intercept from a Graph and Table, Finding Slope from a Graph, Intro to Slope-Intercept Form, Graphing in Slope-Intercept Form, Identifying Functions from a Graph and Table
Return To: Home, 8th Grade
What is Slope?
Slope is a measure of the steepness of a line. It is a mathematical concept that describes the rate of change of a line. Slope is often used in mathematics and science to describe the relationship between two variables. In simple terms, slope is the ratio of the change in the vertical (y-axis) direction to the change in the horizontal (x-axis) direction.
Slope is represented by the letter “m” in the slope-intercept equation of a line, which is y = mx + b. The slope of a line can be positive, negative, zero, or undefined. A positive slope means that the line goes up as you move from left to right, while a negative slope means that the line goes down as you move from left to right. A zero slope means that the line is horizontal, and an undefined slope means that the line is vertical.
Slope can also be thought of as the rate of change of a line. In other words, it is the change in the y-coordinate divided by the change in the x-coordinate. This means that slope can be used to calculate the rate of change of a line, which is often used in science and engineering to describe the relationship between two variables.
Overall, understanding slope is an important concept in mathematics and science. It is used to describe the relationship between two variables, and can be used to calculate the rate of change of a line.
Finding Slope from a Table
To find the slope of a line from a table, one needs to know how to calculate the change in y and the change in x between two points. The slope is defined as the ratio of the change in y to the change in x, which is also known as the rise over run. The formula for slope is:
slope = (change in y) / (change in x)
The numerator represents the change in the y-coordinates of two points on the line, while the denominator represents the change in the x-coordinates of the same two points.
When working with a table, the y-coordinates are often listed in one column and the corresponding x-coordinates are listed in another column. To find the slope of the line that passes through these points, one can use the following steps:
- Identify two points on the line from the table.
- Calculate the change in y by subtracting the y-coordinate of the first point from the y-coordinate of the second point.
- Calculate the change in x by subtracting the x-coordinate of the first point from the x-coordinate of the second point.
- Divide the change in y by the change in x to find the slope.
It is important to note that the order in which the two points are selected does not matter, as long as the same two points are used consistently in the numerator and denominator of the slope formula.
To make the process of finding the slope from a table easier, one can also use the following tips:
- Look for patterns in the table that suggest a linear relationship between the x and y values.
- Use a ruler or straightedge to draw a line through the points on the table and estimate the slope visually.
- Use a calculator or spreadsheet program to perform the calculations automatically.
In summary, finding the slope of a line from a table involves calculating the change in y and the change in x between two points on the line, and then dividing the change in y by the change in x. With practice, one can become proficient at identifying linear relationships in tables and calculating slopes accurately and efficiently.
3 Simple Find the Slope of a Table Examples
To determine whether a table represents a linear function, one must identify whether the ratio between the change in y and the change in x is constant. If the ratio is constant, then the table represents a linear function.
- Find the change in the y-values by subtracting from one row to the next.
- Find the change in the x-values by subtracting from one row to the next.
- Divide the difference in the y-values by the difference in the x-values.
Here are some examples of tables and whether they represent a linear function:
Example 1:
| x | y |
|---|---|
| 1 | 2 |
| 2 | 4 |
| 3 | 6 |
In this table, the change in y is always twice the change in x. Therefore, the ratio between the change in y and the change in x is constant, and this table represents a linear function.
Example 2:
| x | y |
|---|---|
| 1 | 3 |
| 2 | 5 |
| 3 | 7 |
| 4 | 9 |
In this table, the change in y is always two more than twice the change in x. Therefore, the ratio between the change in y and the change in x is not constant, and this table does not represent a linear function.
Example 3:
| x | y |
|---|---|
| 1 | 2 |
| 2 | 1 |
| 3 | 0 |
| 4 | -1 |
In this table, the change in y is not always proportional to the change in x. Therefore, the ratio between the change in y and the change in x is not constant, and this table does not represent a linear function.
It is important to note that a table can only represent a linear function if the ratio between the change in y and the change in x is constant. If the ratio is not constant, then the table does not represent a linear function.
5 Quick Finding Slope of a Table Practice Problems
Which Table Represents a Linear Function?
To find the slope of a table, one must first understand what slope is. Slope is the measure of how steep a line is, and it is defined as the change in y over the change in x. In other words, it is the ratio of the vertical change to the horizontal change between any two points on the line.
A table can be used to represent a linear function, which is a function that can be written in the form of y = mx + b, where m is the slope and b is the y-intercept. To find the slope of a table, one can use the formula:
slope = (change in y) / (change in x)
To apply this formula, one can choose any two points on the line and calculate the change in y and change in x between them. Then, the slope can be calculated by dividing the change in y by the change in x.
It is important to note that the slope of a line is the same for all points on that line. Therefore, if one calculates the slope using two different pairs of points on the same line, the result should be the same.
Here are a few examples of how to find the slope of a table using the formula:
- Example 1:
| x | y |
|---|---|
| 1 | 3 |
| 2 | 5 |
To find the slope of this table, one can choose any two points on the line. Let’s choose (1, 3) and (2, 5). The change in y is 5 – 3 = 2, and the change in x is 2 – 1 = 1. Therefore, the slope is:
slope = (change in y) / (change in x) = 2/1 = 2
- Example 2:
| x | y |
|---|---|
| -2 | 6 |
| 4 | -2 |
To find the slope of this table, one can choose any two points on the line. Let’s choose (-2, 6) and (4, -2). The change in y is -2 – 6 = -8, and the change in x is 4 – (-2) = 6. Therefore, the slope is:
slope = (change in y) / (change in x) = -8/6 = -4/3
In summary, to find the slope of a table, one can use the formula: slope = (change in y) / (change in x). By choosing any two points on the line and calculating the change in y and change in x between them, one can find the slope of the line.
Different Types of Slopes
When it comes to finding the slope of a table, there are different types of slopes that one should be aware of. Here are some of the most common types:
Positive Slope
A positive slope is when the line on the graph is going up from left to right. In other words, as the x-values increase, the y-values also increase. This type of slope is usually represented by a positive number in the slope-intercept form of a linear equation. For example, if the slope of a line is 2, then for every one unit increase in the x-value, the y-value will increase by two units.
Negative Slope
A negative slope is the opposite of a positive slope. This is when the line on the graph is going down from left to right. In other words, as the x-values increase, the y-values decrease. This type of slope is usually represented by a negative number in the slope-intercept form of a linear equation. For example, if the slope of a line is -3, then for every one unit increase in the x-value, the y-value will decrease by three units.
Zero Slope
A zero slope is when the line on the graph is horizontal. In other words, the y-values do not change as the x-values increase. This type of slope is usually represented by a zero in the slope-intercept form of a linear equation. For example, if the slope of a line is 0, then the y-value will not change no matter how much the x-value changes.
Undefined Slope
An undefined slope is when the line on the graph is vertical. In other words, the x-values do not change as the y-values increase. This type of slope is usually represented by a variable in the slope-intercept form of a linear equation. For example, if the slope of a line is undefined, then the equation would be x = some number, where x is the variable.
It is important to understand these different types of slopes when finding the slope of a table. By recognizing the type of slope, one can easily determine the direction of the line and the rate of change between the x and y values.
How to find Slope of a Table FAQ
How can I determine the slope of a linear function using a table of values?
To determine the slope of a linear function using a table of values, one needs to choose any two points on the line and calculate the difference in their y-coordinates over the difference in their x-coordinates. This difference represents the slope of the line.
What is the process for finding the slope of a table on Desmos?
To find the slope of a table on Desmos, one needs to input the table of values into the calculator and then select the “Linear Regression” option from the “Add Item” menu. The slope of the resulting line will be displayed on the screen.
How do I find the slope from two points on a table?
To find the slope from two points on a table, one needs to calculate the difference in the y-values of the two points over the difference in their x-values. This difference represents the slope of the line.
What is the formula for finding the slope of a table?
The formula for finding the slope of a table is the same as the formula for finding the slope of a line. It involves calculating the difference in the y-coordinates over the difference in the x-coordinates of any two points on the line.
How can I find the y-intercept from a table of values?
To find the y-intercept from a table of values, one needs to look for the point where the line intersects the y-axis. This point will have an x-coordinate of 0 and a y-coordinate equal to the y-intercept.
What is the relationship between slope and the graph of a table?
The slope of a line represents the rate of change of the y-values with respect to the x-values. A positive slope indicates that the line is increasing from left to right, while a negative slope indicates that the line is decreasing from left to right. A slope of zero indicates a horizontal line.
What is the 2nd step when finding the slope from a table?
The second step when finding the slope from a table is to calculate the difference in the y-coordinates of any two points on the line over the difference in their x-coordinates.
What is the slope on a table graph?
The slope on a table graph represents the rate of change of the y-values with respect to the x-values. It is calculated as the difference in the y-coordinates of any two points on the line over the difference in their x-coordinates.
Finding Slope from a Table Worksheet Video Explanation
Watch our free video on how to Find the Slope from a Table. This video shows how to solve problems that are on our free Finding Slope from Tables worksheet that you can get by submitting your email above.
Watch the free Finding Slope of a Table video on YouTube here: How to Find Slope of a Table
Video Transcript:
This video is about how to find slope of a line one a table. You can get the find slope from a table worksheet used in this video for free by clicking on the link in the description below.
In order to show you how to find slope of a table you have to know what slope is equal to. Slope is equal to the rise of an equation divided by the run of that equation. You could also say slope is equal to the change in the Y values divided by the change in the x value. In talking about slope you have to find the rise and you also have to find the run. We know that the rise is the change in the Y value. We’re going to look at our Y values here and we’re going to count how much we go up or down by.
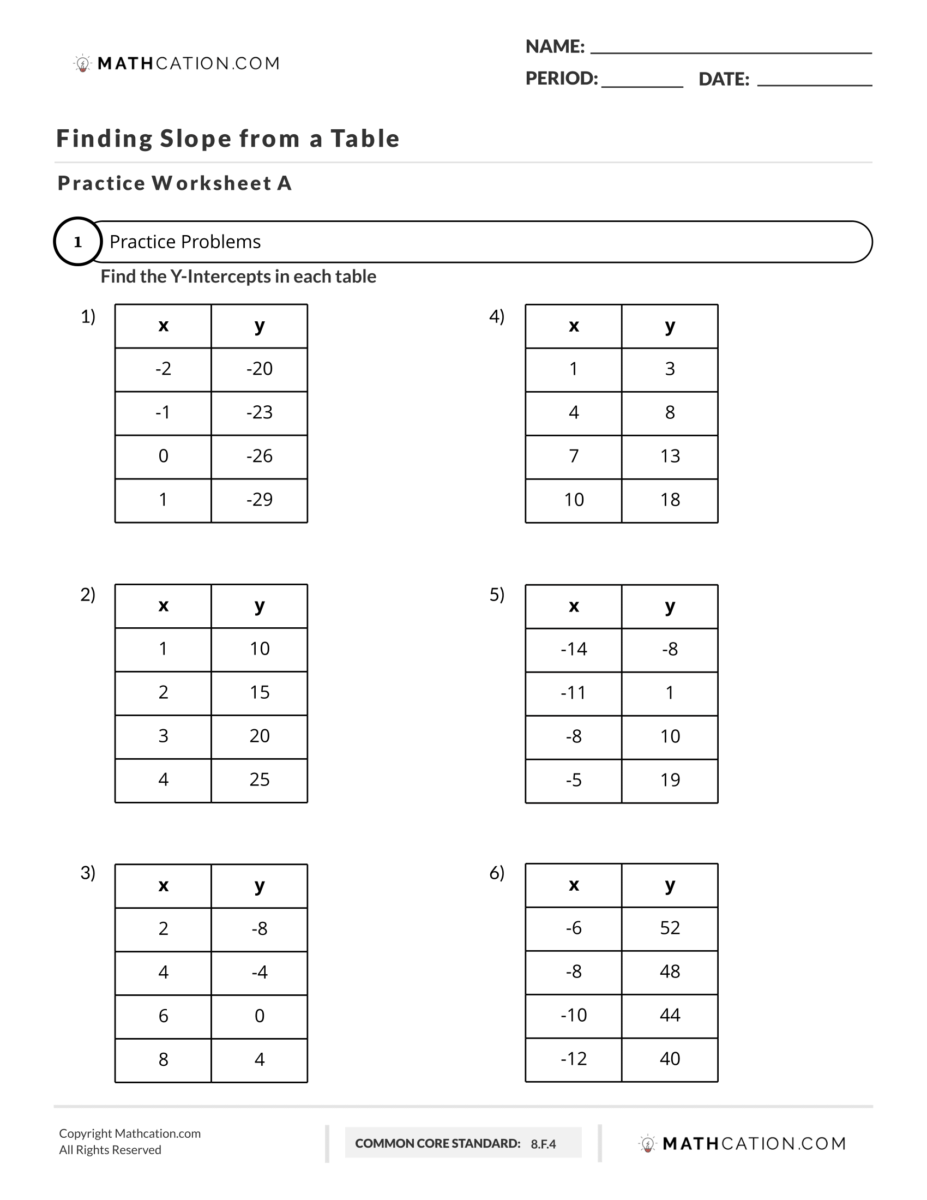
The change in the Y value we go from negative 20 to negative 23 we subtract 3 and then negative 23 to negative 26. We subtract 3 again and then negative 26 to negative 25, 29. We also subtract 3. Our rise which is the change in the Y value is negative 3 because our Y value is being subtracted by 3 each time.
Then you have to find the run and the run is the change in the x value. If we look at our X column, when we go from one cell to the next negative 2 to negative 1 we are adding 1. This is plus 1 negative 1 to 0 this is plus 1 and then 0 to positive 1, this is also plus 1. Our Run will be plus 1 or just one.
Slope is the rise divided by the run the rise is negative 3 and the run is positive 1 and then of course negative 3 divided by 1 simplifies to negative 3. The slope for our first example will be negative 3.
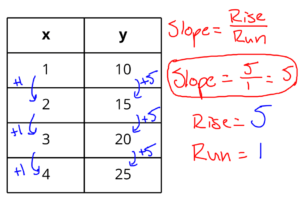
For number two or given a new table we have to find the slope again and we have to remember that slope is the rise divided by the run. In order to find how to find slope of a table, we have to first find the rise from our table and we have to find the run from our table as well. We need to look at when we go from one cell to the next. When go from one cell to the next ten to fifteen fifteen to twenty twenty to twenty five we are adding five each time. The change in our Y value, or the rise, is five.
Then we have to do the same thing for the run or the change in the X column. If we look at our X column we are once again adding 1 each time so, plus one plus one plus one. The Run will be plus one. Our slope will be the rise divided by the run or five divided by one which is of course equal to five. The slope for number two is five.
Here’s the last problem we’re going to show you how to find the slope of a table. Slope is of course equal to the rise divided by the run. In order to find slope you have to first find the rise and you have to also find the run. We already know that the rise is a change in the Y values. In order to find the rise we have to look at our change in Y values. When we go from one Y value to the next in this example 52, this would be minus four to forty eight forty eight to forty four would be minus four and then 40 four to forty would also be minus four. Our rise is minus four.
Then you have to look at the change in the X values to find the run in this case negative six to negative eight we are subtracting two and then negative eight to negative ten. We’re also subtracting two and then negative 10 to negative twelve is also subtracting two. The run is also negative two or minus two. Our slope would be the rise which is negative four divided by the run which is negative two. Now this is not simplified we have to then simplify it. We’re going to take negative 4 divided by negative 2 and when you divide negatives they become positive. The negatives cancel and then 4 divided by 2 is positive 2. Our answer is positive 2.
Free Finding Slope from a Table worksheet download
Enter your email to download the free Finding Slope from a Table worksheet
Practice makes Perfect.
We have hundreds of math worksheets for you to master.
Share This Page