
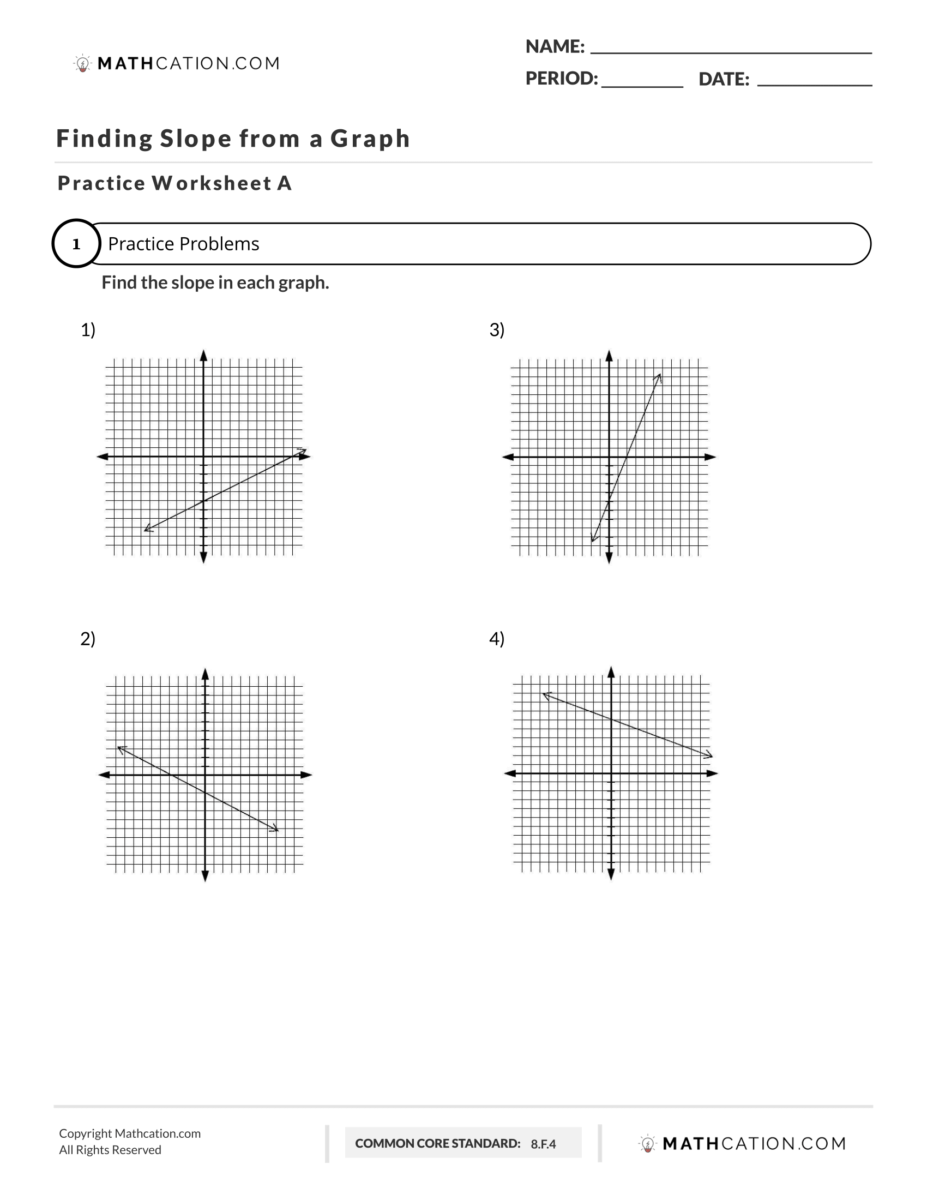
How to find the Slope of a Graph Worksheet, Formula, and Definition
Get the free How to Find the Slope of a Graph worksheet and other resources for teaching & understanding How to Find the Slope of a Graph

Key Points about finding Slope of a Graph
- Slope is a measure of the steepness of a line and is calculated by dividing the change in the y-coordinate by the change in the x-coordinate between two points on the line.
- The slope formula is (y2 – y1) / (x2 – x1), where (x1, y1) and (x2, y2) are the coordinates of the two points.
- By understanding the slope formula and how to graph a line, you can quickly and accurately calculate the slope of a graph.
What is Slope in Math?
Finding Slope from a Graph relies on knowing that Slope is a ratio between the difference in the y-values divided by the difference in the x-values. When finding the slope, you must first find the difference in y-values in the graph. In order to Calculate the Slope of a Graph you find two points on the line. You then count how many spaces you have to go up by or down by. If you go up, the y-difference is positive and if you go down the y-difference is negative.You must then find the difference in the x-values in the graph.
You use the same two points as when you found the y-difference, except this time you could how many spaces you go left or right. If you go right, the x-difference is positive and if you go down the x-difference is negative. The last step is to divide the difference in the y-values by the difference in the x-values. Anytime you Find Slope from a Graph you must reduce the fraction if it can be reduced. You can download the Find the Slope Worksheet by clicking on the button on the right hand side of this page.
Understanding how to find the slope of a graph is an important skill in mathematics. Slope is a measure of the steepness of a line and is calculated by dividing the change in the y-coordinate by the change in the x-coordinate between two points on the line. Once you understand how to calculate the slope of a graph, you can use this information to help you solve problems in algebra, geometry, and other areas of math.
To calculate the slope of a graph, you need to know the coordinates of two points on the line. You can then use the slope formula to calculate the slope of the line. The slope formula is (y2 – y1) / (x2 – x1), where (x1, y1) and (x2, y2) are the coordinates of the two points. If the slope is positive, the line is increasing from left to right. If the slope is negative, the line is decreasing from left to right. If the slope is zero, the line is horizontal, and if the slope is undefined, the line is vertical.
Learning how to find the slope of a graph can be challenging at first, but with practice, it becomes easier. By understanding the slope formula and how to graph a line, you can quickly and accurately calculate the slope of a graph. In the following sections, we will explore the formula for calculating slope, graphing slope and y-intercept, and examine some examples of slope graphs.
Common Core Standard: 8.F.C.4
Basic Topics:
Related Topics: Finding Y-Intercept from a Graph and Table, Finding Slope from a Table, Intro to Slope-Intercept Form, Graphing in Slope-Intercept Form, Identifying Functions from a Graph and Table
Return To: Home, 8th Grade

What is Slope of a Line?
Defining Slope
Slope is a measure of the steepness of a line on a graph. It is defined as the ratio of the vertical change between two points on a line to the horizontal change between the same two points. Slope is often denoted by the letter “m” and is calculated using the formula:
m = (y2 – y1) / (x2 – x1)
where (x1, y1) and (x2, y2) are two points on the line.
Understanding Graphs
Graphs are visual representations of data that are used to show relationships between variables. In a graph, the horizontal axis is usually used to represent one variable, while the vertical axis is used to represent another variable. Lines on a graph are used to show how these variables are related. The slope of a line on a graph can provide important information about the relationship between the variables being represented.
Positive Slopes
A positive slope indicates that the line on the graph is increasing from left to right. This means that as the value of the variable on the horizontal axis increases, the value of the variable on the vertical axis also increases. A positive slope is often associated with a direct relationship between the variables being represented.
Negative Slopes
A negative slope indicates that the line on the graph is decreasing from left to right. This means that as the value of the variable on the horizontal axis increases, the value of the variable on the vertical axis decreases. A negative slope is often associated with an inverse relationship between the variables being represented.
Steepness
The steepness of a line on a graph is determined by the magnitude of the slope. A larger slope indicates a steeper line, while a smaller slope indicates a less steep line. The slope can be used to determine the rate of change between the variables being represented.
In summary, the slope of a line on a graph is a measure of the steepness of the line and provides important information about the relationship between the variables being represented. Positive slopes indicate a direct relationship between the variables, while negative slopes indicate an inverse relationship. The steepness of the line is determined by the magnitude of the slope and can be used to determine the rate of change between the variables.
How to Calculate Slope of a Graph
Calculating the slope of a graph is an essential skill in math and science. The slope of a graph represents the rate of change between two points on the graph. It is a measure of how steep or gradual the graph is. This section will explain how to find the slope of a graph using two methods: finding slope from two points and using a slope calculator.
Finding Slope from Two Points
The most common method to find the slope of a graph is by using two points on the graph. To use this method, you need to know the coordinates of two points on the graph. Let’s call these points (x1, y1) and (x2, y2). The slope of the graph can be calculated using the formula:
Slope = (y2 – y1) / (x2 – x1)
This formula is also known as the “rise over run” formula or the “delta y over delta x” formula. The numerator represents the change in the y-coordinate or the rise, while the denominator represents the change in the x-coordinate or the run.
For example, suppose you have two points on the graph, (2, 4) and (6, 10). To find the slope of the graph between these two points, you can use the formula:
Slope = (10 – 4) / (6 – 2) = 6/4 = 3/2
The slope of the graph between these two points is 3/2 or 1.5.
Using Slope Calculator
Another method to find the slope of a graph is by using a slope calculator. A slope calculator is a tool that can quickly calculate the slope of a graph using two points. You can find many slope calculators online or use a graphing calculator that has a built-in slope function.
To use a slope calculator, you need to input the coordinates of two points on the graph. The calculator will then calculate the slope of the graph using the formula mentioned above.
Using a slope calculator can save time and reduce the chances of making calculation errors. However, it is still essential to understand how to calculate the slope of a graph manually.
In summary, finding the slope of a graph is an essential skill in math and science. You can find the slope of a graph by using two points on the graph or by using a slope calculator. Both methods are effective and can be used interchangeably.
Slope of a Graph Formula
When it comes to graphing linear equations, finding the slope of a line is an essential skill. The slope of a line indicates the steepness of the line and can be used to determine the rate of change of the line. There are different ways to find the slope of a graph, including the slope formula, slope intercept form, and point slope form.
Slope Formula
The slope formula is a straightforward way to find the slope of a line, given two points on the line. The formula is:
slope = (y2 - y1) / (x2 - x1)
Where (x1, y1) and (x2, y2) are the coordinates of the two points.
To use the slope formula, simply plug in the values of the two points and simplify the expression to find the slope. It is important to note that the slope formula works for any two points on a line, not just the two endpoints.
Slope Intercept Form
Another way to find the slope of a line is to use the slope intercept form of a linear equation. The slope intercept form is:
y = mx + b
Where m is the slope of the line and b is the y-intercept.
To find the slope of a line in slope intercept form, simply look at the coefficient of x. For example, if the equation of the line is y = 2x + 3, the slope of the line is 2.
Point Slope Form
The point slope form of a linear equation is another way to find the slope of a line. The point slope form is:
y - y1 = m(x - x1)
Where (x1, y1) is a point on the line and m is the slope of the line.
To find the slope of a line in point slope form, simply look at the coefficient of (x - x1). For example, if the equation of the line is y - 3 = 2(x - 1), the slope of the line is 2.
In summary, there are different ways to find the slope of a graph, including the slope formula, slope intercept form, and point slope form. Each method has its advantages and disadvantages, and it is essential to understand when to use each method. By mastering these methods, one can easily find the slope of a line and graph linear equations with ease.

3 Simple Slope Graph Examples
To better understand how to find the slope of a graph, let’s take a look at some examples.
- Find the change in the y-values.
- If you go up, the y-value is positive. If you go down, the y-value is negative.
- Find the change in the x-values.
- If you go right, the x-value is positive. If you go left, the x-value is negative.
- Divide your change in the y-values but the change in the x-values.
Example 1
Consider the following graph:
| x | y |
|---|---|
| 0 | 1 |
| 2 | 5 |
To find the slope of this line, we need to calculate the change in y over the change in x.
The change in y is 5 – 1 = 4, and the change in x is 2 – 0 = 2.
Therefore, the slope of the line is 4/2 = 2.
Example 2
Now, let’s consider a graph with three points:
| x | y |
|---|---|
| 1 | 2 |
| 3 | 6 |
| 5 | 10 |
To find the slope of this line, we can choose any two points and calculate the change in y over the change in x.
Let’s choose the first two points:
The change in y is 6 – 2 = 4, and the change in x is 3 – 1 = 2.
Therefore, the slope of the line between the first two points is 4/2 = 2.
Now, let’s choose the last two points:
The change in y is 10 – 6 = 4, and the change in x is 5 – 3 = 2.
Therefore, the slope of the line between the last two points is 4/2 = 2.
Since both lines have the same slope, we can conclude that this line is a straight line and has a constant slope of 2.
Example 3
Consider the following graph:
| x | y |
|---|---|
| 0 | 1 |
| 1 | 3 |
| 2 | 5 |
To find the slope of this line, we can choose any two points and calculate the change in y over the change in x.
Let’s choose the first two points:
The change in y is 3 – 1 = 2, and the change in x is 1 – 0 = 1.
Therefore, the slope of the line between the first two points is 2/1 = 2.
Now, let’s choose the last two points:
The change in y is 5 – 3 = 2, and the change in x is 2 – 1 = 1.
Therefore, the slope of the line between the last two points is 2/1 = 2.
Since both lines have the same slope, we can conclude that this line is a straight line and has a constant slope of 2.
By analyzing these examples, we can see that the slope of a line is a measure of its steepness and can be calculated by finding the change in y over the change in x between any two points on the line.
5 Quick Graphing Slope Intercept Form Practice Problems
Graphing Slope and Y-Intercept
When graphing a linear equation, it is essential to understand how to find the slope and y-intercept. The slope of a line describes its steepness, while the y-intercept is the point where the line intersects the y-axis. Understanding these concepts is crucial when graphing a line.
Understanding X and Y Intercepts
To graph a line, it is necessary to know the x and y intercepts. The x-intercept is the point where the line crosses the x-axis, while the y-intercept is the point where the line crosses the y-axis. To find the x-intercept, set y to zero in the equation and solve for x. To find the y-intercept, set x to zero and solve for y.
Using Midpoint Calculator
Another way to find the slope of a line is to use the midpoint calculator. This tool calculates the midpoint of two points and the slope of the line that passes through them. To use the midpoint calculator, enter the coordinates of two points, and the calculator will determine the midpoint and the slope of the line.
The slope of a line is the ratio of the change in y to the change in x. It is also known as the gradient of the line. The equation of a line can be written in slope-intercept form, which is y = mx + b, where m is the slope, and b is the y-intercept.
In conclusion, understanding how to find the slope and y-intercept of a line is essential when graphing linear equations. One can use the x and y intercepts or the midpoint calculator to determine the slope of the line. The slope is the ratio of the change in y to the change in x and is also known as the gradient of the line. The equation of a line can be written in slope-intercept form, which is y = mx + b, where m is the slope, and b is the y-intercept.
How to Graph Slope FAQ
What is the formula for finding slope on a graph?
The formula for finding slope on a graph is the change in y divided by the change in x. This can be written as:
Slope = (y2 - y1) / (x2 - x1)
How do you find the slope of a line using two points on a graph?
To find the slope of a line using two points on a graph, you can use the slope formula. Simply plug in the values for the two points into the formula:
Slope = (y2 - y1) / (x2 - x1)
What is the slope of a line that is horizontal?
The slope of a line that is horizontal is 0. This is because a horizontal line has no vertical change, only horizontal change. And since slope is the ratio of vertical change to horizontal change, the slope of a horizontal line is 0.
How do you find the slope of a table?
To find the slope of a table, you can create a graph of the data and use the slope formula. Alternatively, you can use the formula:
Slope = (y2 - y1) / (x2 - x1)
where x and y represent the variables in the table.
What is the difference between positive and negative slope?
A positive slope indicates that the line is increasing from left to right. In other words, as x increases, y also increases. A negative slope indicates that the line is decreasing from left to right. In other words, as x increases, y decreases.
How do you find the slope of a line in physics?
To find the slope of a line in physics, you can use the same formula as for finding slope on a graph:
Slope = (y2 - y1) / (x2 - x1)
where x and y represent the variables in the physics equation. For example, if you have a graph of distance vs. time, you can use the formula to find the slope, which represents the speed of the object.
Finding Slope from a Graph Worksheet Video Explantion
Watch our free video on how to Find the Slope of a Graph. This video shows how to solve problems that are on our free Finding Slope from a Graph worksheet 8th grade that you can get by submitting your email above.
Watch the free Finding the Slope of a Graph video on YouTube here: How to find the Slope of a Graph
Video Transcript:
This video is about how to find the slope of a graph. You can get the worksheet used in this video for free by clicking on the link in the description below.
Here we are the first problem for how to find slope of a line. When talking about slope we have to remember that slope is equal to the rise of a equation divided by the run of the equation. Or the change in the Y values divided by the change in the x value.
In order to find the slope of this equation for the first problem, we have to find two points that are on the line. In order to do that you have to find spots on this line that cross the grid exactly. You’re looking at points of intersection where it crosses the grid perfectly. A good example of this would be right here at this point and then right here at this point and then right here at this point and so on. This is because they cross the grid perfectly. The points in between them are not good because they do not cross the grid at an exact spot.
Now looking at our points we have to figure out how we go from one point to the next. What we’re gonna do is we are going to draw how much we go up by and how much we go over by each time. Here we go up here we go over here’s our rise then our run here’s our rise then our run. Then we have to find what is the rise and then what is the run for this equation or rise each time is one because we’re going up one. This is up one this is up one this is up one. We go up one each time so the rise will be one. Then we have to find the run. How much do we go over by we go over by one two. We go over two spaces one two two spaces one two two spaces so the run has to be two.
Now we know that slope is equal to the rise divided by the run. We just take our rise which is one and we will write it on top of our fraction and then our run which is two and we will write it on the bottom of our fraction. Our slope for this problem is 1/2 or 1/2.
For number two we are given a new equation on the coordinate grid. In order to find the slope for this, we once again have to find the rise and we also have to find the run. In order to do that we are going to pick points on the line that cross the grid perfectly. If you look at our grid here and our line crosses right there perfectly, here perfectly, here, here, and so on. You could also go backwards if you wanted to.
Now when we do this we have to find the rise and we also have to find the run. We have to find how much we go up or down by and how much we go over by. In order to go from one point to the next in our example we start at this point we go down one we go over we go down one we go over 2 down 1 over 2 and so on. Our rise this time is down and because we’re going down that means the rise has to be negative. we’re going down 1 so our rise is negative 1.
The rise will be negative 1 and then the run will go over 1, 2 spaces, 1 2 spaces so the run is 2. Just like in the first problem, the slope is the rise divided by the run. We will do the rise on top which is negative 1 divided by the run which is positive 2. Our slope for number 2 is negative 1/2. This video has been about how to find the slope in a graph and how to find slope of a line.
Free Finding Slope from a Graph worksheet download
Enter your email to download the free Finding Slope from a Graph worksheet
Practice makes Perfect.
We have hundreds of math worksheets for you to master.
Share This Page